DxChart<T>.MaxBubbleSize Property
Specifies the diameter of the biggest bubble in bubble series.
Namespace: DevExpress.Blazor
Assembly: DevExpress.Blazor.v26.1.dll
Declaration
[DefaultValue(0.2)]
[Parameter]
public double MaxBubbleSize { get; set; }
Property Value
| Type | Default | Description |
|---|---|---|
| Double | 0.2 | The ratio between the biggest bubble’s diameter and the smaller chart or pane side. |
Remarks
The bubble diameter (size) in DxChartBubbleSeries is specified by the SizeField property. To calculate the diameter of the biggest bubble, the DxChart component uses the following formula:
d = MaxBubbleSize * min(height, width), where height and width are the sizes of the chart container. If the chart contains multiple panes, the height and width parameters are the same as the pane sizes.
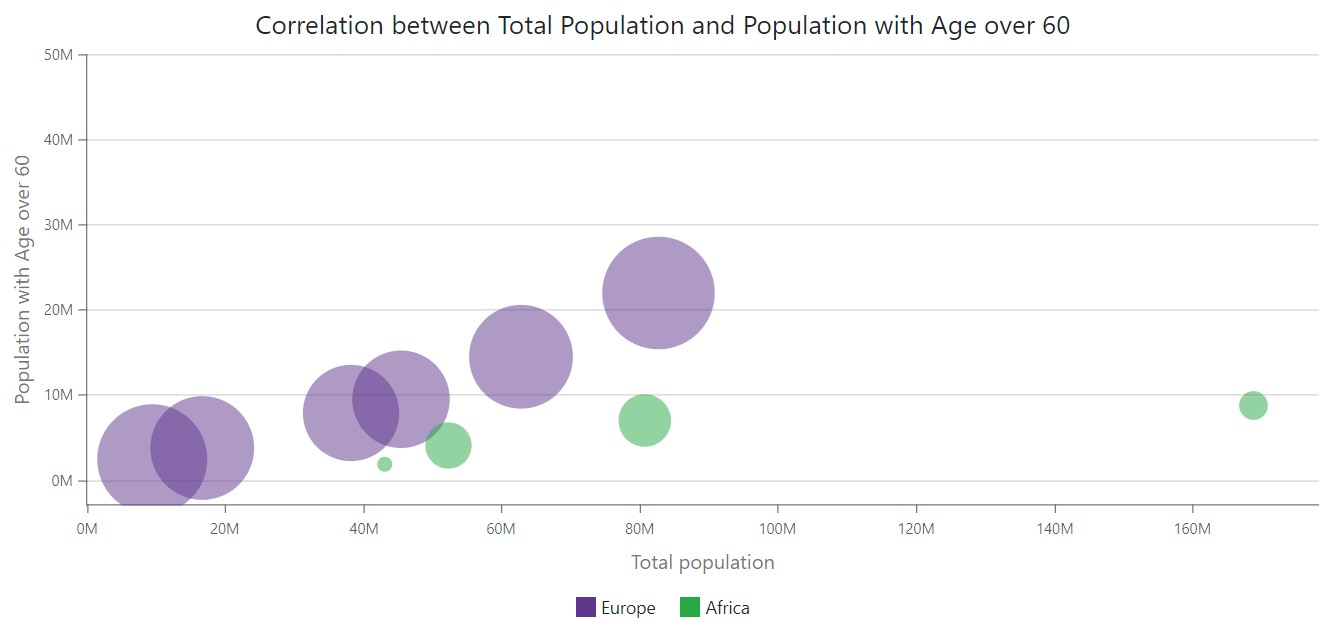
The following code calculates the biggest bubble’s diameter based on the chart’s height and sets the diameter to 0.25 * 500 px = 125 px:
<DxChart @ref="@chart"
         Data="@chartsData"
         MaxBubbleSize="0.25"
         Width="100%"
         Height="500px">
    <DxChartTitle Text="Correlation between Total Population and Population with Age over 60" />
    <DxChartBubbleSeries Name="Europe"
                         T="PopulationCorrelationDataPoint"
                         TArgument="double"
                         TValue="double"
                         TSize="double"
                         ArgumentField="pc => pc.TotalPopulation"
                         ValueField="pc => pc.Older60Population"
                         SizeField="pc => pc.Older60Population / pc.TotalPopulation"
                         Filter='pc => pc.Region == "Europe"' />
    <DxChartBubbleSeries Name="Africa"
                         T="PopulationCorrelationDataPoint"
                         TArgument="double"
                         TValue="double"
                         TSize="double"
                         ArgumentField="pc => pc.TotalPopulation"
                         ValueField="pc => pc.Older60Population"
                         SizeField="pc => pc.Older60Population / pc.TotalPopulation"
                         Filter='pc => pc.Region == "Africa"' />
    <DxChartLegend Position="RelativePosition.Outside"
                   VerticalAlignment="VerticalEdge.Bottom"
                   HorizontalAlignment="HorizontalAlignment.Center"
                   Orientation="Orientation.Horizontal" />
    <DxChartArgumentAxis>
        <DxChartAxisTitle Text="Total population" />
        <DxChartAxisLabel Format='ChartElementFormat.FromLdmlString("#0M")' />
    </DxChartArgumentAxis>
    <DxChartValueAxis EndOnTick="false" SideMarginsEnabled="false">
        <DxChartAxisTitle Text="Population with Age over 60" />
        <DxChartAxisLabel Format='ChartElementFormat.FromLdmlString("#0M")' />
        <DxChartAxisRange StartValue = "-3" EndValue = "50"/>
    </DxChartValueAxis>
</DxChart>

@code {
    IEnumerable<PopulationCorrelationDataPoint> chartsData;

    protected override async Task OnInitializedAsync() {
        chartsData = await PopulationCorrelation.GetData();
    }
}