ChartValueErrorBarType Enum
Lists algorithms that calculate error bar values.
Namespace: DevExpress.Blazor
Assembly: DevExpress.Blazor.v26.1.dll
Declaration
public enum ChartValueErrorBarTypeMembers
| Name | Description |
|---|---|
None
|
Obtains error values from data source fields specified by HighValueField and LowValueField properties. |
Percent
|
Error bars display percentage of argument values. Percentage factor is specified by the Value property. |
StdError
|
Indicates the standard error. You can specify a coefficient to adjust the function result (use the Value property). |
StdDeviation
|
Indicates the standard deviation. You can specify a coefficient to adjust the function result (use the Value property). |
Variance
|
Indicates variance. You can specify a coefficient to adjust the function result (use the Value property). |
Fixed
|
Error bars display constant values specified by the Value property. |
Related API Members
The following properties accept/return ChartValueErrorBarType values:
Remarks
The Type property specifies how a chart calculates or where it obtains error bar values. All available methods can be grouped into three categories:
Calculate statistical functions. When the Type property is set to
Variance,StdError, orStdDeviation, the control calculates the specified function and displays its value as error bars. Note that you can adjust the result by a coefficient assigned to the Value property. The default coefficient is1.Display fixed or percentage bars. Set the Type property to
FixedorPercent, and use the Value property to specify a fixed error value or a percentage (applied to the current series point value).Obtain error values from a data source. When the Type property is set to
Noneor unspecified, use HighValueField and LowValueField properties to specify data source fields that contain error values.
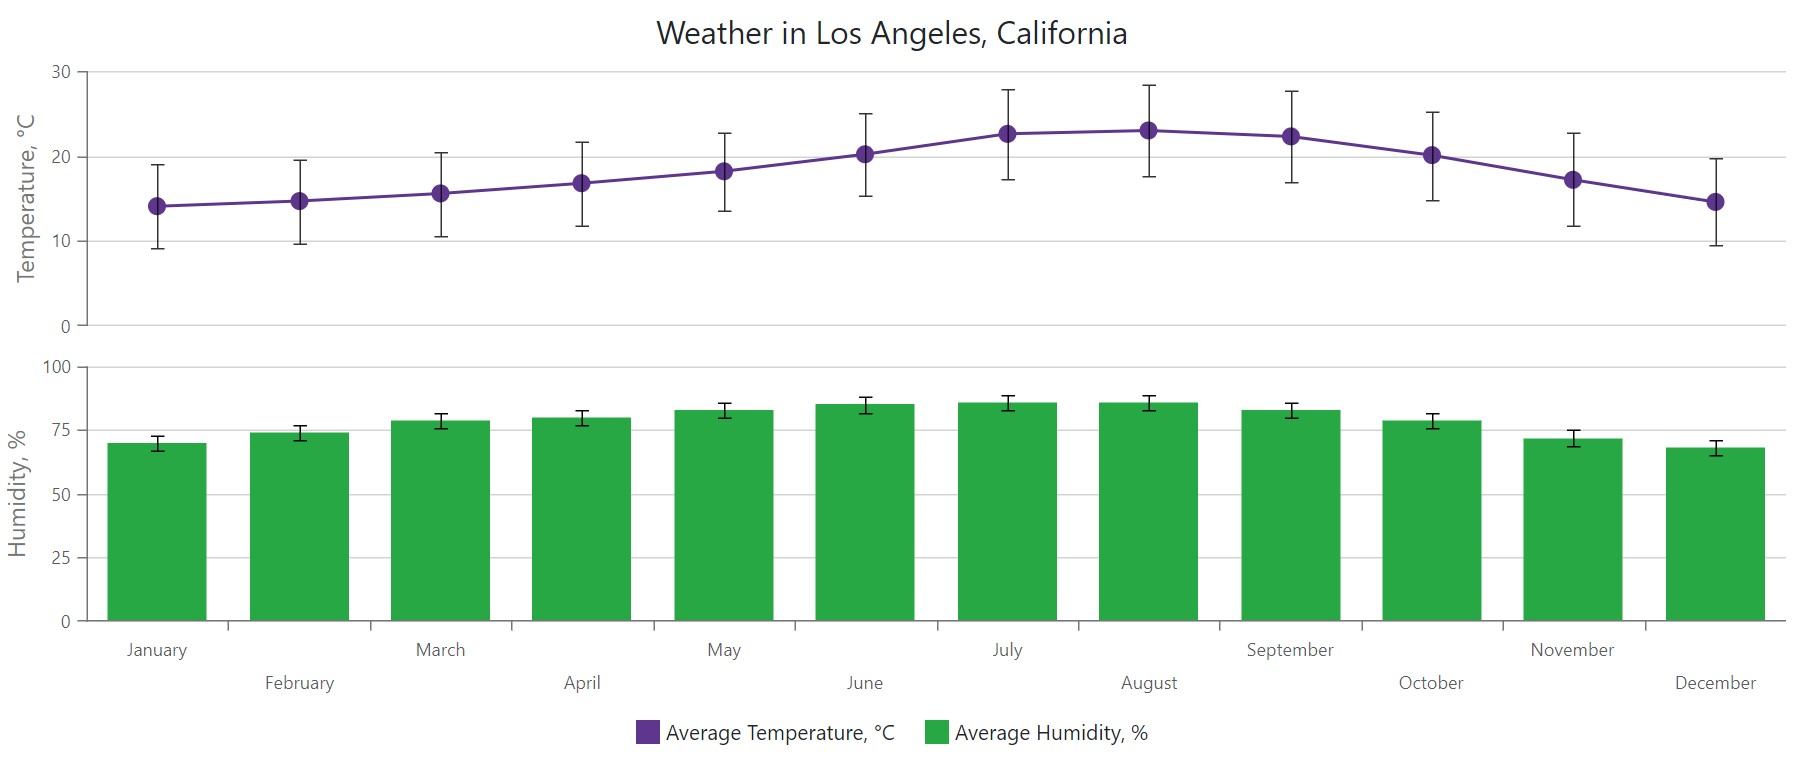
@inject IChartAverageTemperatureDataProvider ChartAverageTemperatureDataProvider
<DxChart Data="@DataSource">
    @* ... *@
    <DxChartLineSeries Pane="TopPane"
                       Name="@LineSeriesName"
                       ArgumentField="@((AverageTemperatureData i) => i.Month)"
                       ValueField="@((AverageTemperatureData i) => i.AverageTemperature)">
        <DxChartSeriesValueErrorBar LowValueField="@nameof(AverageTemperatureData.AverageLowTemperature)"
                                    HighValueField="@nameof(AverageTemperatureData.AverageHighTemperature)"
                                    LineWidth="1"
                                    Opacity="0.8"/>
    </DxChartLineSeries>
    <DxChartBarSeries Pane="BottomPane"
                      Name="@BarSeriesName"
                      ArgumentField="@((AverageTemperatureData i) => i.Month)"
                      ValueField="@((AverageTemperatureData i) => i.AverageHumidity)">
        <DxChartSeriesValueErrorBar Type="ChartValueErrorBarType.Fixed"
                                    Value="@ErrorBarValue"
                                    LineWidth="1" />
    </DxChartBarSeries>
    @* ... *@
</DxChart>

@code {
    IEnumerable<AverageTemperatureData> DataSource = Enumerable.Empty<AverageTemperatureData>();
    double ErrorBarValue = 6;
    protected override void OnInitialized() {
        DataSource = ChartAverageTemperatureDataProvider.GenerateData();
    }
    // ...
}