ChartAxisAlignment Enum
Lists values that specify next to which edge the Chart should display an axis.
Namespace: DevExpress.Blazor
Assembly: DevExpress.Blazor.v25.2.dll
NuGet Package: DevExpress.Blazor
Declaration
public enum ChartAxisAlignmentMembers
| Name | Description |
|---|---|
Near
|
The Chart displays an axis next to the left or bottom edge of the pane. |
Far
|
The Chart displays an axis next to the right or top edge of the pane. |
Related API Members
The following properties accept/return ChartAxisAlignment values:
Remarks
Use the Alignment property to define a pane edge next to which to display an axis. The edge choice depends on the axis Alignment and the Chart’s Rotated property values. The following table shows how axes map their Alignment property values to pane edges if the Rotated property is not specified or set to false:
| Axis | Near | Far |
|---|---|---|
| Argument | Bottom | Top |
| Value | Left | Right |
If the Rotated property is set to true, the Chart swaps its axes:
| Axis | Near | Far |
|---|---|---|
| Argument | Left | Right |
| Value | Bottom | Top |
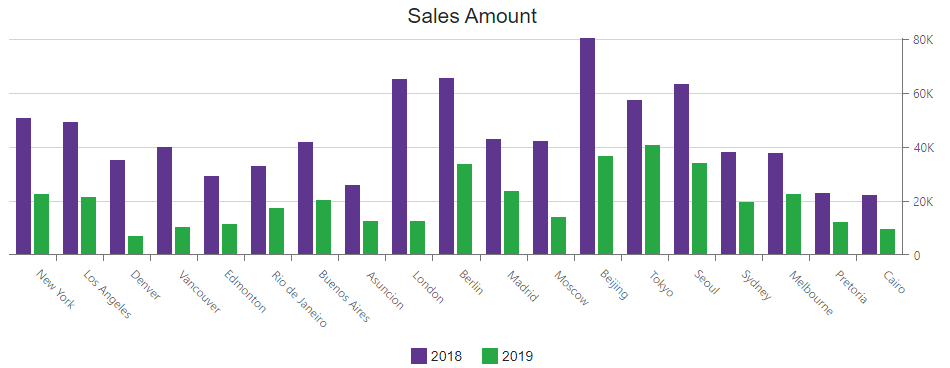
The following example displays the value axis at the right edge of the pane:
<DxChart Data="@dataSource">
    <DxChartTitle Text="Sales Amount" />
    <DxChartLegend Position="RelativePosition.Outside" VerticalAlignment="VerticalEdge.Bottom" />
    <DxChartBarSeries Name="2018"
                      Filter="@((SaleInfo s) => s.Date.Year == 2018)"
                      SummaryMethod="Enumerable.Sum"
                      ArgumentField="@(s => s.City)"
                      ValueField="@(s => s.Amount)" />
    <DxChartBarSeries Name="2019"
                      Filter="@((SaleInfo s) => s.Date.Year == 2019)"
                      SummaryMethod="Enumerable.Sum"
                      ArgumentField="@(s => s.City)"
                      ValueField="@(s => s.Amount)" />
    <DxChartValueAxis Alignment="ChartAxisAlignment.Far" />
</DxChart>
