DxChartSplineSeries<T, TArgument, TValue> Class
Defines a spline series.
Namespace: DevExpress.Blazor
Assembly: DevExpress.Blazor.v26.1.dll
Declaration
public class DxChartSplineSeries<T, TArgument, TValue> :
    DxChartLineSeriesBase<T, TArgument, TValue>
Type Parameters
| Name | Description |
|---|---|
| T | The data type. |
| TArgument | The argument type. |
| TValue | The value type. |
Remarks
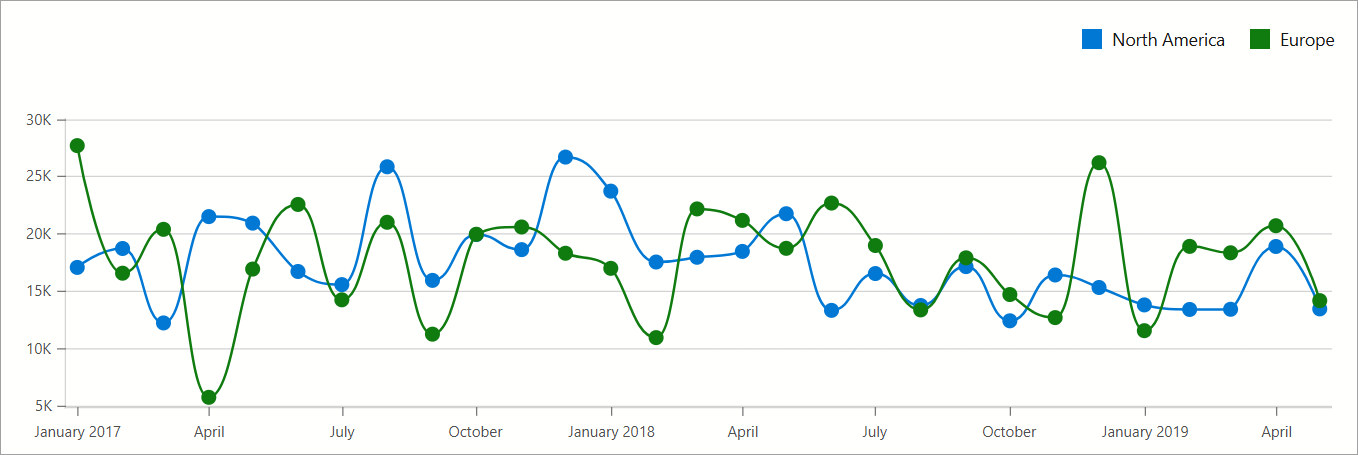
Spline series display data as points connected by smooth curves. Follow the steps below to create a spline series:
- Use the DxChart.Data property to specify a data source.
- Add a
DxChartSplineSeriesobject to chart markup. - Use series ArgumentField and ValueField properties to specify data source fields that supply arguments and values for chart points.
- Optional. Specify series Filter and SummaryMethod properties to filter and aggregate series values.
The following example filters data by region. It also groups arguments by date and calculates aggregate values using the Enumerable.Sum method. For a sample data source, refer to our GitHub repository.
@inject ISalesInfoDataProvider Sales

<DxChart Data="@ChartsData"
         Width="100%"
         LabelOverlap="ChartLabelOverlap.Hide">
    <DxChartSplineSeries Name="North America"
                         T="SaleInfo"
                         TArgument="DateTime"
                         TValue="int"
                         ArgumentField="si => new DateTime(si.Date.Year, si.Date.Month, 1)"
                         ValueField="si => si.Amount"
                         SummaryMethod="Enumerable.Sum"
                         Filter='si => si.Region == "North America" '
                         HoverMode="ChartContinuousSeriesHoverMode.None">
        <DxChartSeriesPoint Visible=ShowSeriesPointMarkers
                            HoverMode="ChartSeriesPointHoverMode.None" />
        <DxChartSeriesLabel Visible=ShowSeriesLabels
                            ValueFormat="ChartElementFormat.Thousands(1)" />
    </DxChartSplineSeries>
    <DxChartSplineSeries Name="Europe"
                         T="SaleInfo"
                         TArgument="DateTime"
                         TValue="int"
                         ArgumentField="si => new DateTime(si.Date.Year, si.Date.Month, 1)"
                         ValueField="si => si.Amount"
                         SummaryMethod="Enumerable.Sum"
                         Filter='si => si.Region == "Europe"'
                         HoverMode="ChartContinuousSeriesHoverMode.None">
        <DxChartSeriesPoint Visible=ShowSeriesPointMarkers
                            HoverMode="ChartSeriesPointHoverMode.None" />
        <DxChartSeriesLabel Visible=ShowSeriesLabels
                            ValueFormat="ChartElementFormat.Thousands(1)" />
    </DxChartSplineSeries>
    <DxChartLegend Position="RelativePosition.Outside"
                   HorizontalAlignment="HorizontalAlignment.Right" />
@* ... *@
</DxChart>
@* ... *@
@code {
    IEnumerable<SaleInfo> ChartsData;

    [Parameter] public bool ShowSeriesPointMarkers { get; set; }
    [Parameter] public bool ShowSeriesLabels { get; set; }

    protected override async Task OnInitializedAsync() {
        ChartsData = await Sales.GetSalesAsync();
    }
}
Inheritance
Object
ComponentBase
DxSettingsComponent<DevExpress.Blazor.Internal.IXYChartSeriesModel>
DxComplexSettingsComponent<DxChartSeries, DevExpress.Blazor.Internal.IXYChartSeriesModel>
DxChartSeries
DxChartXYSeries<T, TArgument, TValue, TValue>
DxChartLineSeriesBase<T, TArgument, TValue>
DxChartSplineSeries<T, TArgument, TValue>
See Also