DxChartAggregationSettings Class
Contains data aggregation settings.
Namespace: DevExpress.Blazor
Assembly: DevExpress.Blazor.v26.1.dll
Declaration
public class DxChartAggregationSettings :
    DxSettingsComponent<ChartAggregationSettingsModel>
Remarks
The <DxChart> component can use aggregate methods to group data and decrease the number of visible points. This feature allows you to optimize chart performance.
Data aggregation is available for the X-axis. The chart splits the X-axis into intervals, aggregates data for each interval and shows the result values as series points. When users zoom the chart, it re-aggregates data.
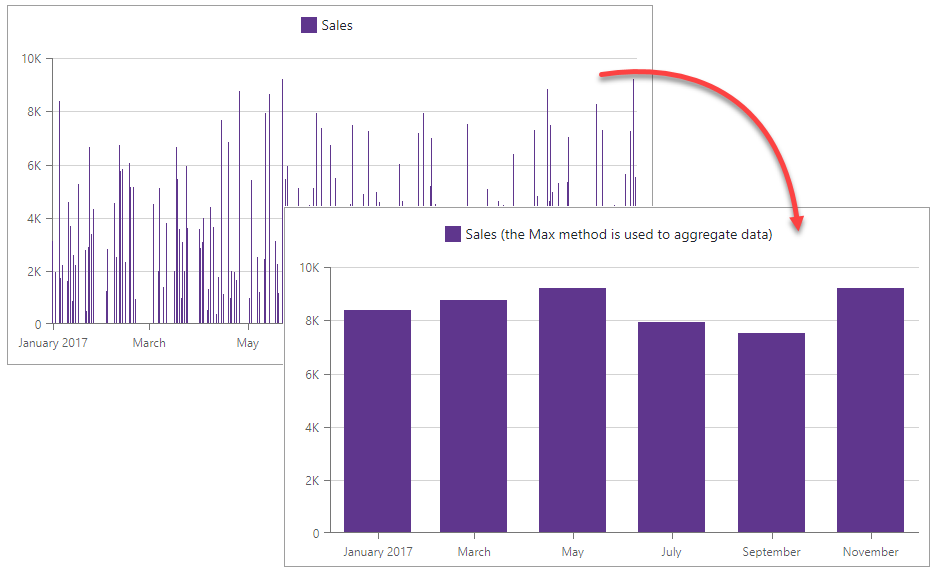
To enable aggregation, add a DxChartAggregationSettings object to the markup and set its Enabled property to true. To specify an aggregation method, use the Method property (the default method is Auto).
<DxChart T="BargainDataPoint"
            Data="@UsdJpyData"
            @key="@Params.ThemeName"
            CssClass="chart-container">
    <DxChartLegend Position="RelativePosition.Inside"
                    VerticalAlignment="VerticalEdge.Top"
                    HorizontalAlignment="HorizontalAlignment.Right" />
    <DxChartLineSeries T="BargainDataPoint"
                        TArgument="DateTime"
                        TValue="double"
                        ArgumentField="i => i.DateTimeStamp"
                        ValueField="i => i.Price"
                        Name="USDJPY">
        <DxChartSeriesPoint Visible="false" />
        <DxChartAggregationSettings Enabled="true"
                                    Method="ChartAggregationMethod.Average" />
    </DxChartLineSeries>
    <DxChartArgumentAxis>
        <DxChartAxisRange StartValue="new DateTime(2020, 01, 01)"
                            EndValue="new DateTime(2021, 01, 29)" />
    </DxChartArgumentAxis>
    <DxChartZoomAndPanSettings ArgumentAxisZoomAndPanMode="ChartAxisZoomAndPanMode.Both" />
    <DxChartScrollBarSettings ArgumentAxisScrollBarVisible="true"
                                ArgumentAxisScrollBarPosition="ChartScrollBarPosition.Bottom" />
    <DxChartTooltip Enabled="true" Position="RelativePosition.Outside">
        <div class="tooltip-content">
            <div class="tooltip-title">@(((DateTime)context.Point.Argument).ToString("d"))</div>
            <div>1$ = @(context.Point.Value)¥</div>
        </div>
    </DxChartTooltip>
</DxChart>

@code {
    IEnumerable<BargainDataPoint> UsdJpyData;
    @inject ICurrencyExchangeDataProvider UsdJpyDataProvider

    protected override async Task OnInitializedAsync() {
        UsdJpyData = await UsdJpyDataProvider.GetDataAsync();
    }
}
You can specify the following aggregation-related properties for the argument axis:
- AggregationInterval
- Specifies the width of aggregation intervals in axis units. Applies only to axes of continuous and logarithmic types.
- AggregationGroupWidth
- Specifies the width of aggregation intervals in pixels. Applies only to axes of continuous and logarithmic types.
- AggregatedPointPosition
- Specifies where aggregated series points appear relative to major tick marks. Applies only to axes of continuous and logarithmic types.
Aggregation vs Summaries
You can also use summary methods to decrease the number of visible points and optimize chart performance.
The table below describes the difference between aggregation and summaries.
| Aggregation | Summaries | |
|---|---|---|
| Points to Group | The chart aggregates points with different argument values (on a specific interval of X-axis). | The chart calculates summaries for points with the same argument value. |
| Behavior on Zoom | The chart aggregates data when it loads them and re-aggregates data when users zoom the chart. | The chart calculates summaries only when it loads data. |
If you use an aggregation method and a summary method in the same series, the chart first calculates summaries and then uses result values as initial values for aggregation.