DxChartBubbleSeries<T, TArgument, TValue, TSize> Class
Defines a bubble series.
Namespace: DevExpress.Blazor
Assembly: DevExpress.Blazor.v26.1.dll
Declaration
public class DxChartBubbleSeries<T, TArgument, TValue, TSize> :
    DxChartXYSeries<T, TArgument, TValue, TSize>
Type Parameters
| Name | Description |
|---|---|
| T | The type of data. |
| TArgument | The type of series arguments. |
| TValue | The type of series values. |
| TSize | The type of series size values. |
Remarks
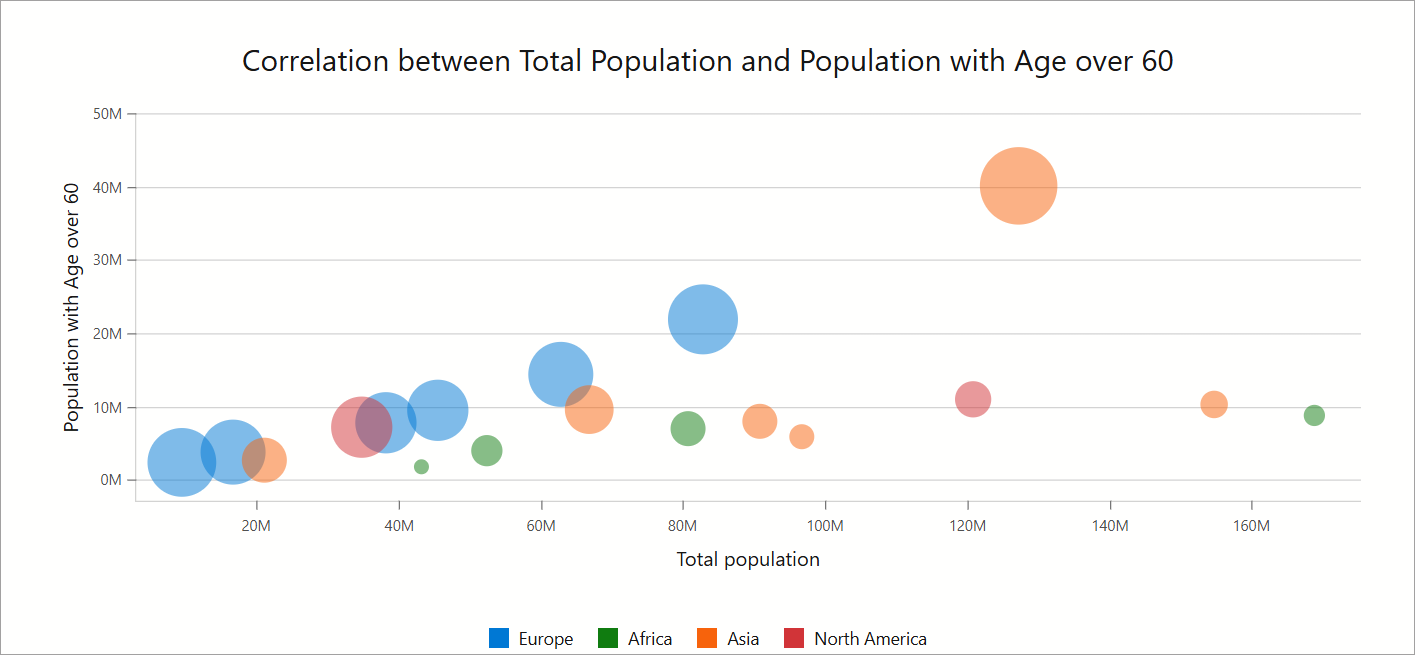
The bubble series displays data as individual bubbles of different sizes. Follow the steps below to create a bubble series:
- Use the DxChart.Data property to specify an IEnumerable<T> data source.
- Add a
DxChartBubbleSeriesobject to chart markup. - Use series ArgumentField and ValueField properties to specify data source fields that contain arguments and values.
- Use the DxChartBubbleSeries.SizeField property to specify a data source field that supplies bubble sizes.
For a sample data source, refer to our GitHub repository.
@using System.Text.RegularExpressions
@using System.Drawing;
@* ... *@
@inject IPopulationCorrelationDataProvider PopulationCorrelation
<DxChart @ref="@chart"
         Data="@chartsData"
         Width="100%"
         Height="500px">
    <DxChartTitle Text="Correlation between Total Population and Population with Age over 60" />

    <DxChartBubbleSeries Name="Europe"
                         T="PopulationCorrelationDataPoint"
                         TArgument="double"
                         TValue="double"
                         TSize="double"
                         ArgumentField="pc => pc.TotalPopulation"
                         ValueField="pc => pc.Older60Population"
                         SizeField="pc => pc.Older60Population / pc.TotalPopulation"
                         Filter='pc => pc.Region == "Europe"' />
    <DxChartBubbleSeries Name="Africa"
                         T="PopulationCorrelationDataPoint"
                         TArgument="double"
                         TValue="double"
                         TSize="double"
                         ArgumentField="pc => pc.TotalPopulation"
                         ValueField="pc => pc.Older60Population"
                         SizeField="pc => pc.Older60Population / pc.TotalPopulation"
                         Filter='pc => pc.Region == "Africa"' />
    <DxChartBubbleSeries Name="Asia"
                         T="PopulationCorrelationDataPoint"
                         TArgument="double"
                         TValue="double"
                         TSize="double"
                         ArgumentField="pc => pc.TotalPopulation"
                         ValueField="pc => pc.Older60Population"
                         SizeField="pc => pc.Older60Population / pc.TotalPopulation"
                         Filter='pc => pc.Region == "Asia"' />
    <DxChartBubbleSeries Name="North America"
                         T="PopulationCorrelationDataPoint"
                         TArgument="double"
                         TValue="double"
                         TSize="double"
                         ArgumentField="pc => pc.TotalPopulation"
                         ValueField="pc => pc.Older60Population"
                         SizeField="pc => pc.Older60Population / pc.TotalPopulation"
                         Filter='pc => pc.Region == "North America"' />


    <DxChartLegend Position="RelativePosition.Outside"
                   VerticalAlignment="VerticalEdge.Bottom"
                   HorizontalAlignment="HorizontalAlignment.Center"
                   Orientation="Orientation.Horizontal" />

    <DxChartArgumentAxis>
        <DxChartAxisTitle Text="Total population" />
        <DxChartAxisLabel Format='ChartElementFormat.FromLdmlString("#0M")' />
    </DxChartArgumentAxis>

    <DxChartValueAxis EndOnTick="false" SideMarginsEnabled="false">
        <DxChartAxisTitle Text="Population with Age over 60" />
        <DxChartAxisLabel Format='ChartElementFormat.FromLdmlString("#0M")' />
        <DxChartAxisRange StartValue = "-3" EndValue = "50"/>
    </DxChartValueAxis>
@* ... *@
</DxChart>
@* ... *@
@code {
    IEnumerable<PopulationCorrelationDataPoint> chartsData;
    DxChartBase chart;

    async void ExportChart(ChartExportFormat format) {
        await chart?.ExportAsync("BubbleChart", format);
    }
    protected override async Task OnInitializedAsync() {
        chartsData = await PopulationCorrelation.GetData();
    }
}
Inheritance
Object
ComponentBase
DxSettingsComponent<DevExpress.Blazor.Internal.IXYChartSeriesModel>
DxComplexSettingsComponent<DxChartSeries, DevExpress.Blazor.Internal.IXYChartSeriesModel>
DxChartSeries
DxChartXYSeries<T, TArgument, TValue, TSize>
DxChartBubbleSeries<T, TArgument, TValue, TSize>
See Also