DxChartAxisGridLines Class
Defines settings for axis grid lines.
Namespace: DevExpress.Blazor
Assembly: DevExpress.Blazor.v26.1.dll
Declaration
public class DxChartAxisGridLines :
    DxSettingsComponent<ChartAxisGridLinesModel>
Remarks
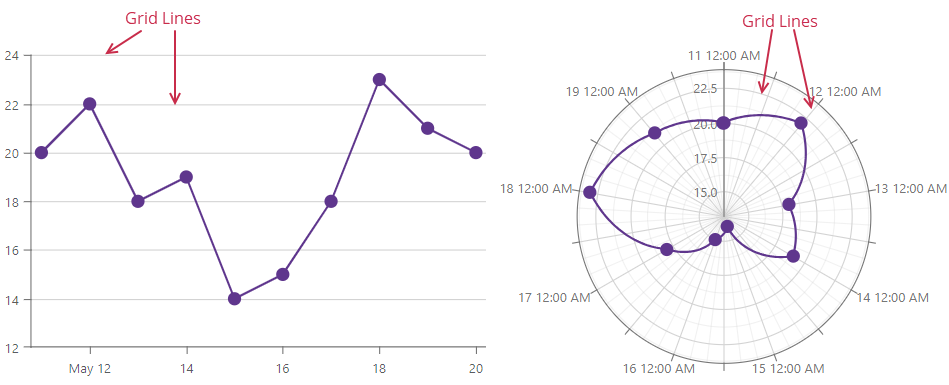
Grid lines span the entire plot area in <DxChart> and <DxPolarChart>. These lines help users to compare point positions with corresponding axis values.
Use the DxChartAxisGridLines object to customize grid lines in the following components:
- DxChart<T>
- A control that visualizes bound data as graphs: bar, area, line, and others.
- DxPolarChart<T>
- A control that visualizes bound data as graphs in polar coordinates.
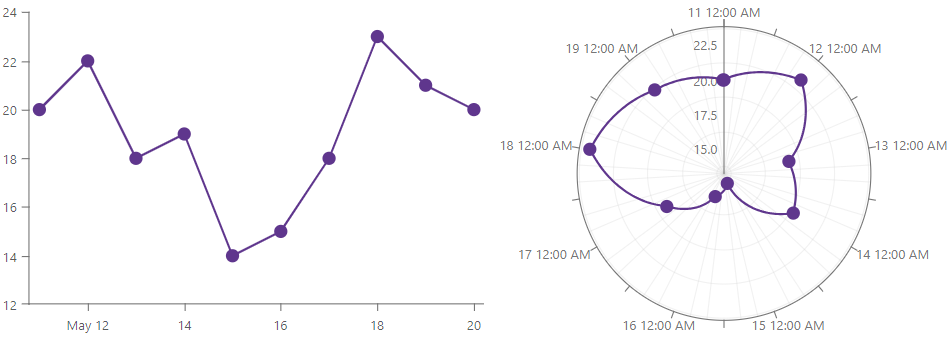
The following example disables grid lines:
<DxChart Data="forecasts">
    <DxChartLineSeries ArgumentField="@((WeatherForecast v) => v.Date)"
                       ValueField="@((WeatherForecast v) => v.TemperatureC)" />
    <DxChartValueAxis>
        <DxChartAxisGridLines Visible="false" />
    </DxChartValueAxis>
    @* ... *@
</DxChart>
Inheritance
Object
ComponentBase
DxSettingsComponent<DevExpress.Blazor.Internal.ChartAxisGridLinesModel>
DxChartAxisGridLines
See Also