DxChart<T>.SynchronizeAxes Property
Indicates whether to synchronize value axes when they are displayed on a single pane.
Namespace: DevExpress.Blazor
Assembly: DevExpress.Blazor.v26.1.dll
Declaration
[DefaultValue(true)]
[Parameter]
public bool SynchronizeAxes { get; set; }
Property Value
| Type | Default | Description |
|---|---|---|
| Boolean | true |
|
Remarks
For example, when the Chart synchronizes two axes, it does the following:
- Divides the second axis into intervals. The number of intervals is equal to the number of intervals of the first axis. The intervals are marked by ticks.
- Aligns the ticks of both axes.
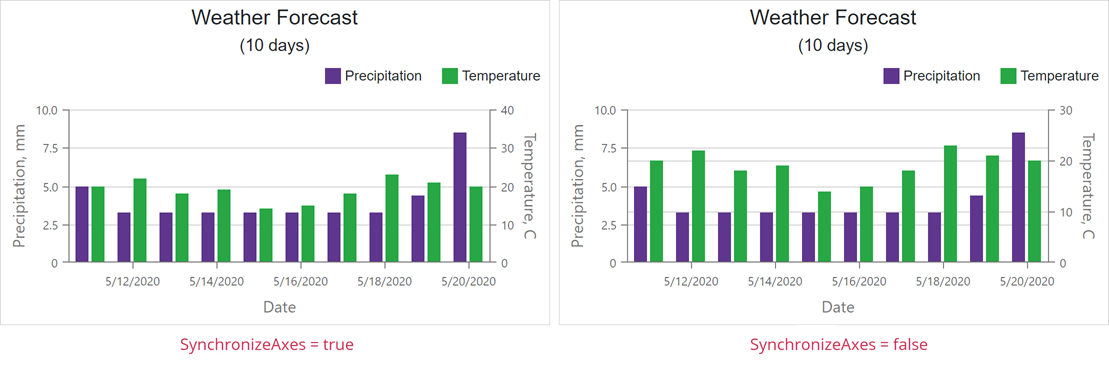
The default behavior automatically selects axis values for axis synchronization.
Use the SynchronizedValue property to align axes at specific values.
Example
The following example synchronizes the Precipitation axis with the Temperature axis at values 2 and 10, respectively:
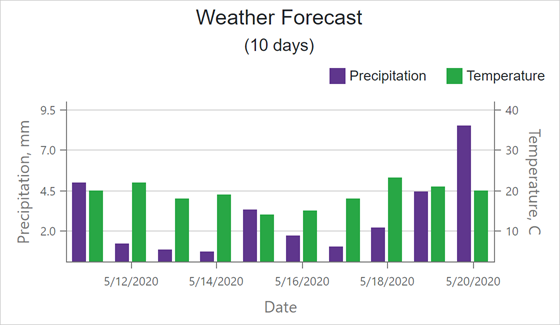
<DxChart SynchronizeAxes=true>
    <DxChartValueAxis SynchronizedValue=2>
        <DxChartAxisTitle Text="Precipitation, mm" />
    </DxChartValueAxis>
    <DxChartValueAxis Name="Temperature"
                      Alignment="ChartAxisAlignment.Far"
                      SynchronizedValue=10>
        <DxChartAxisTitle Text="Temperature, C" />
    </DxChartValueAxis>
    <DxChartBarSeries ArgumentField="@((WeatherForecast i) => i.Date)"
                      ValueField="@((WeatherForecast i) => i.Precipitation)"
                      Name="Precipitation">
    </DxChartBarSeries>
    <DxChartBarSeries ArgumentField="@((WeatherForecast i) => i.Date)"
                      ValueField="@((WeatherForecast i) => i.TemperatureC)"
                      Name="Temperature"
                      Axis="Temperature">
    </DxChartBarSeries>
</DxChart>
See Also