DxChartFullStackedBarSeries<T, TArgument, TValue> Class
Defines a full stacked bar series.
Namespace: DevExpress.Blazor
Assembly: DevExpress.Blazor.v26.1.dll
Declaration
public class DxChartFullStackedBarSeries<T, TArgument, TValue> :
    DxChartStackedBarSeriesBase<T, TArgument, TValue>
Type Parameters
| Name | Description |
|---|---|
| T | The data type. |
| TArgument | The argument type. |
| TValue | The value type. |
Remarks
The full stacked bar series displays the percentage value of multiple bar series for each argument.
Follow the steps below to create a full stacked bar series:
- Use the DxChart.Data property to specify an IEnumerable<T> data source.
- Add a
DxChartFullStackedBarSeriesobject to chart makrup. - Use series ArgumentField and ValueField properties to specify data source fields that contain arguments and values for chart points.
- Optional. Use the Stack property to create a side-by-side bar chart.
For a sample data source, refer to our GitHub repository.
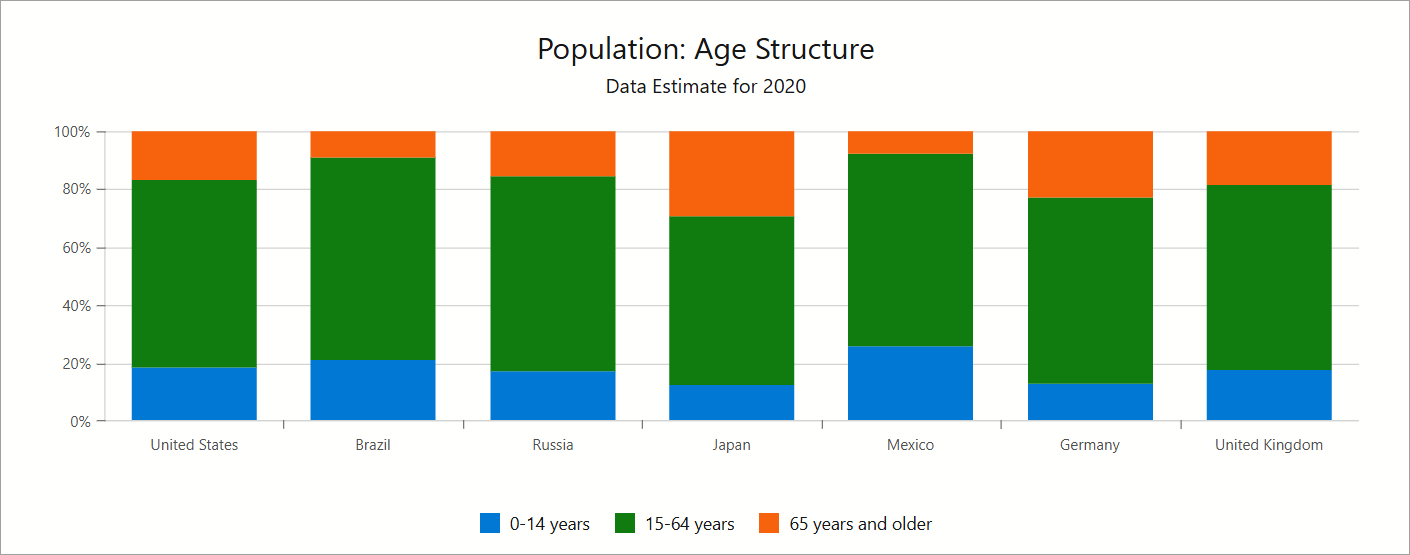
@inject IPopulationStructureDataProvider DataProvider

<DxChart T="PopulationAgeStructureItem"
         Data="@ChartsData"
         Width="100%">
    <DxChartTitle Text="Population: Age Structure">
        <DxChartSubTitle Text="Data Estimate for 2020" />
    </DxChartTitle>
    <DxChartFullStackedBarSeries Name="0-14 years"
                                 T="PopulationAgeStructureItem"
                                 TArgument="string"
                                 TValue="int"
                                 ArgumentField="pasi => pasi.Country"
                                 ValueField="pasi => pasi.Population"
                                 SummaryMethod="Enumerable.Sum"
                                 Filter='pasi => pasi.AgeGroup == "0-14 years"' />
    <DxChartFullStackedBarSeries Name="15-64 years"
                                 T="PopulationAgeStructureItem"
                                 TArgument="string"
                                 TValue="int"
                                 ArgumentField="pasi => pasi.Country"
                                 ValueField="pasi => pasi.Population"
                                 SummaryMethod="Enumerable.Sum"
                                 Filter='pasi => pasi.AgeGroup == "15-64 years"' />
    <DxChartFullStackedBarSeries Name="65 years and older"
                                 T="PopulationAgeStructureItem"
                                 TArgument="string"
                                 TValue="int"
                                 ArgumentField="pasi => pasi.Country"
                                 ValueField="pasi => pasi.Population"
                                 SummaryMethod="Enumerable.Sum"
                                 Filter='pasi => pasi.AgeGroup == "65 years and older"' />
    <DxChartLegend Position="RelativePosition.Outside"
                   HorizontalAlignment="HorizontalAlignment.Center"
                   VerticalAlignment="VerticalEdge.Bottom" />
@* ... *@
</DxChart>
@* ... *@
@code {
    IEnumerable<PopulationAgeStructureItem> ChartsData;

    protected override async Task OnInitializedAsync() {
        ChartsData = await DataProvider.QueryData();
    }
}
Inheritance
Object
ComponentBase
DxSettingsComponent<DevExpress.Blazor.Internal.IXYChartSeriesModel>
DxComplexSettingsComponent<DxChartSeries, DevExpress.Blazor.Internal.IXYChartSeriesModel>
DxChartSeries
DxChartXYSeries<T, TArgument, TValue, TValue>
DxChartBarSeriesBase<T, TArgument, TValue>
DxChartStackedBarSeriesBase<T, TArgument, TValue>
DxChartFullStackedBarSeries<T, TArgument, TValue>
See Also