DxChart<T>.AdjustOnZoom Property
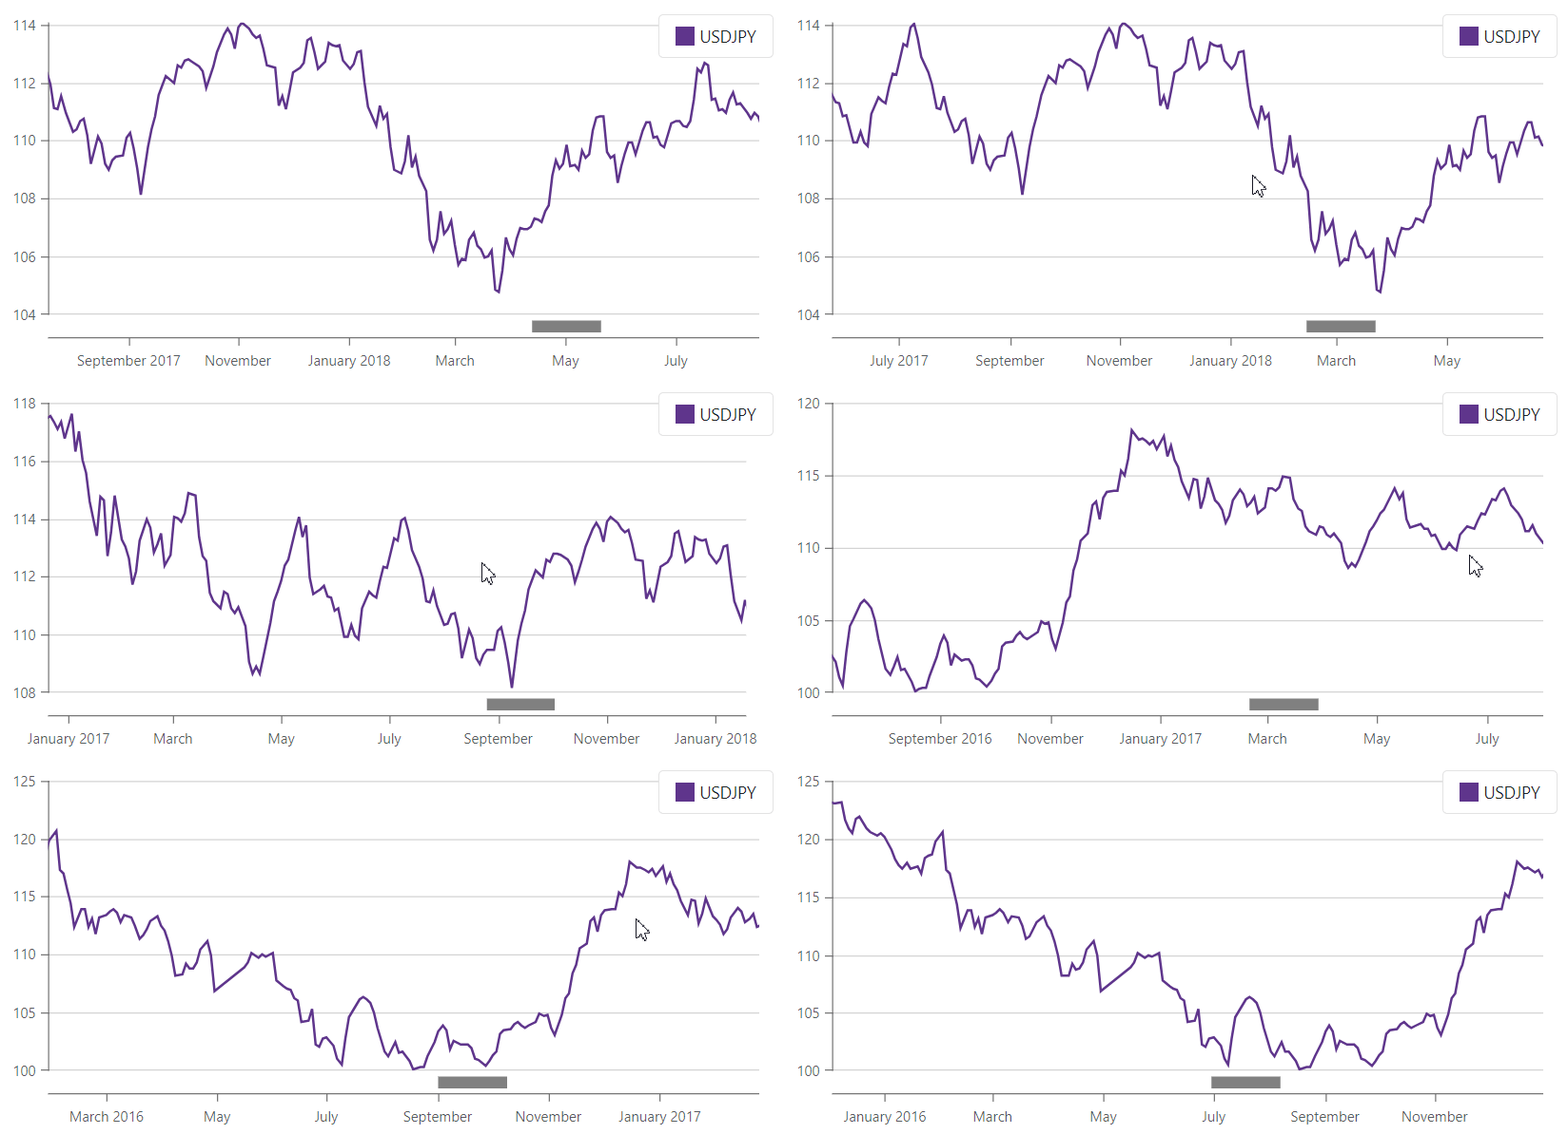
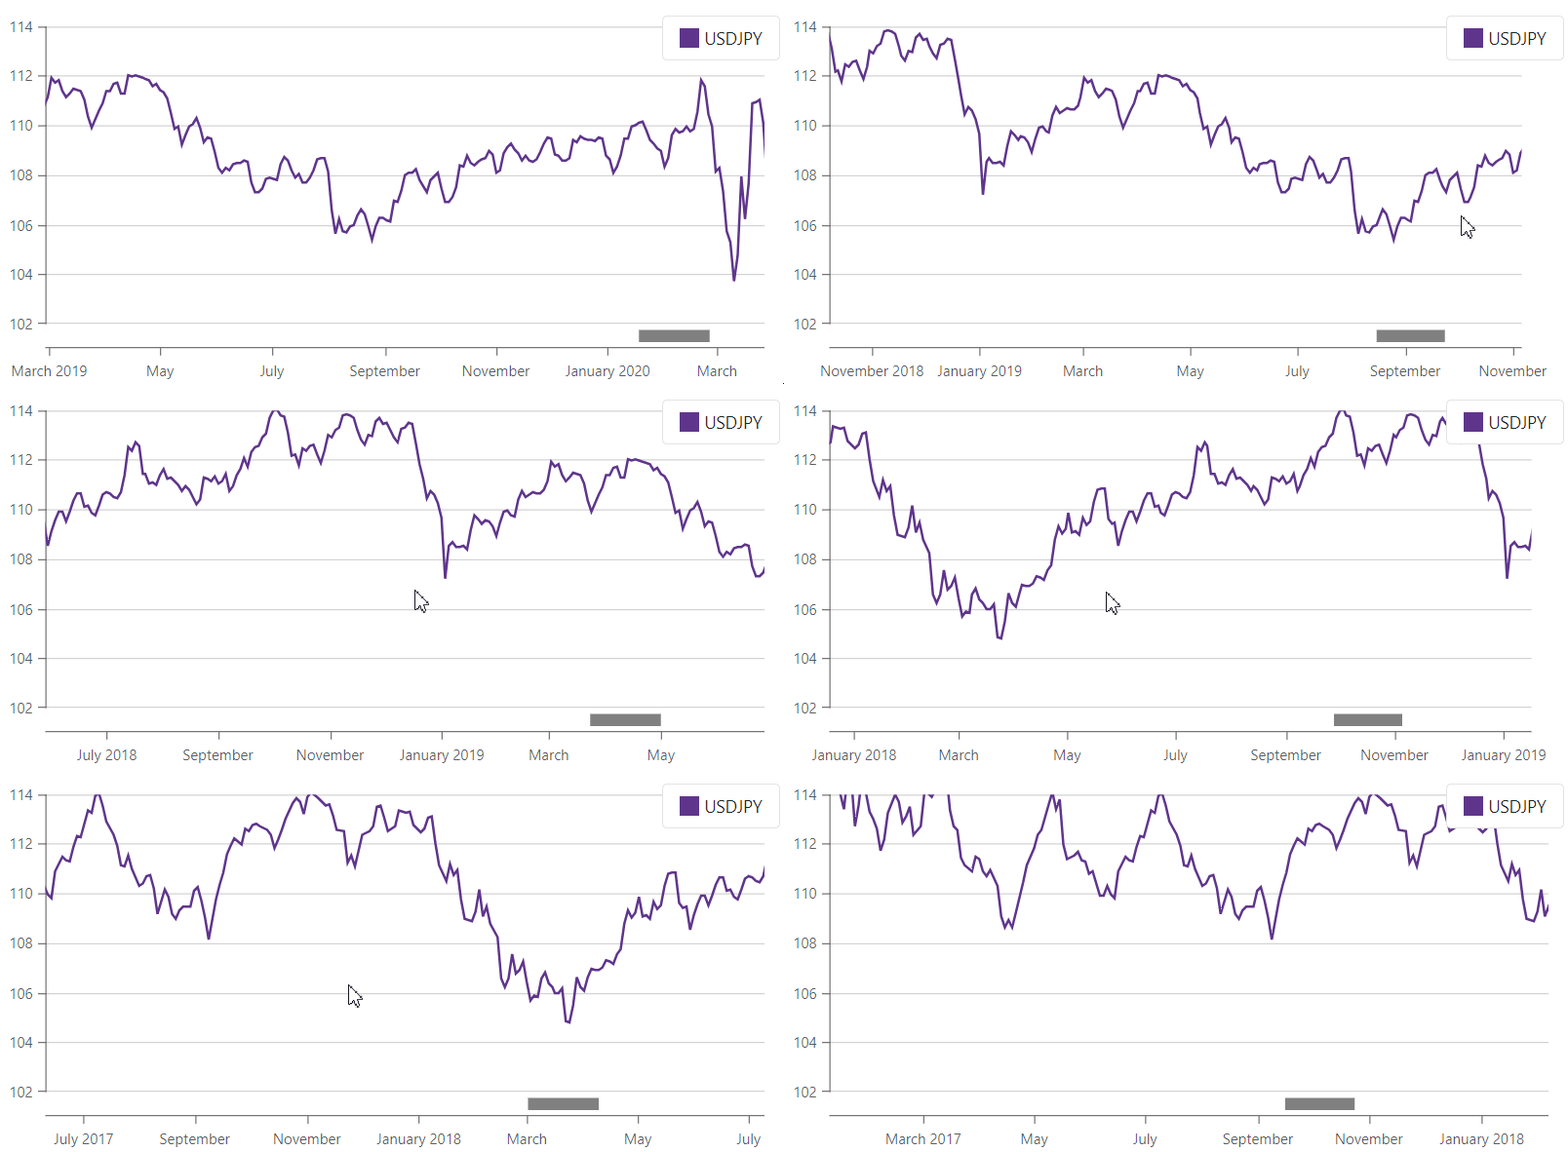
Specifies whether to adjust the visual range of the value axis when users zoom or pan the argument axis.
Namespace: DevExpress.Blazor
Assembly: DevExpress.Blazor.v25.2.dll
NuGet Package: DevExpress.Blazor
Declaration
[DefaultValue(true)]
[Parameter]
public bool AdjustOnZoom { get; set; }
Property Value
| Type | Default | Description |
|---|---|---|
| Boolean | true |
|
Remarks
When a user zooms, pans, or scrolls the argument axis, the chart changes the range of series values accordingly – it increases or decreases as follows:

Set the AdjustOnZoom property to false to change the default behavior. In this case, the chart displays the maximum visual range of the value axis and does not change this range on a user’s zoom, pan, or scroll actions.
<DxChart @ref="@chart"
            T="DatePricePoint"
            Data="@UsdJpyData"
            AdjustOnZoom="false"
            Width="100%">
    <DxChartLegend Position="RelativePosition.Inside"
                   VerticalAlignment="VerticalEdge.Top"
                   HorizontalAlignment="HorizontalAlignment.Right" />
    <DxChartLineSeries T="DatePricePoint"
                       TArgument="DateTime"
                       TValue="double"
                       ArgumentField="i => i.DateTimeStamp"
                       ValueField="i => i.Price"
                       Name="USDJPY">
        <DxChartSeriesPoint Visible="false" />
        <DxChartAggregationSettings Enabled="true"
                                    Method="ChartAggregationMethod.Average" />
    </DxChartLineSeries>
    <DxChartArgumentAxis>
        <DxChartAxisRange StartValue="new DateTime(2020, 01, 01)"
                          EndValue="new DateTime(2021, 01, 29)" />
    </DxChartArgumentAxis>
    <DxChartZoomAndPanSettings ArgumentAxisZoomAndPanMode="ChartAxisZoomAndPanMode.Both" />
    <DxChartScrollBarSettings ArgumentAxisScrollBarVisible="true"
                              ArgumentAxisScrollBarPosition="ChartScrollBarPosition.Bottom" />
</DxChart>

@code {
    IEnumerable<DatePricePoint> UsdJpyData;
    @inject ICurrencyExchangeDataProvider UsdJpyDataProvider

    protected override async Task OnInitializedAsync() {
        UsdJpyData = await UsdJpyDataProvider.GetDataAsync();
    }
}

See Also