ChartVisualRangeUpdateMode Enum
Lists update modes for the axis visual range.
Namespace: DevExpress.Blazor
Assembly: DevExpress.Blazor.v25.2.dll
NuGet Package: DevExpress.Blazor
Declaration
public enum ChartVisualRangeUpdateModeMembers
| Name | Description |
|---|---|
Shift
|
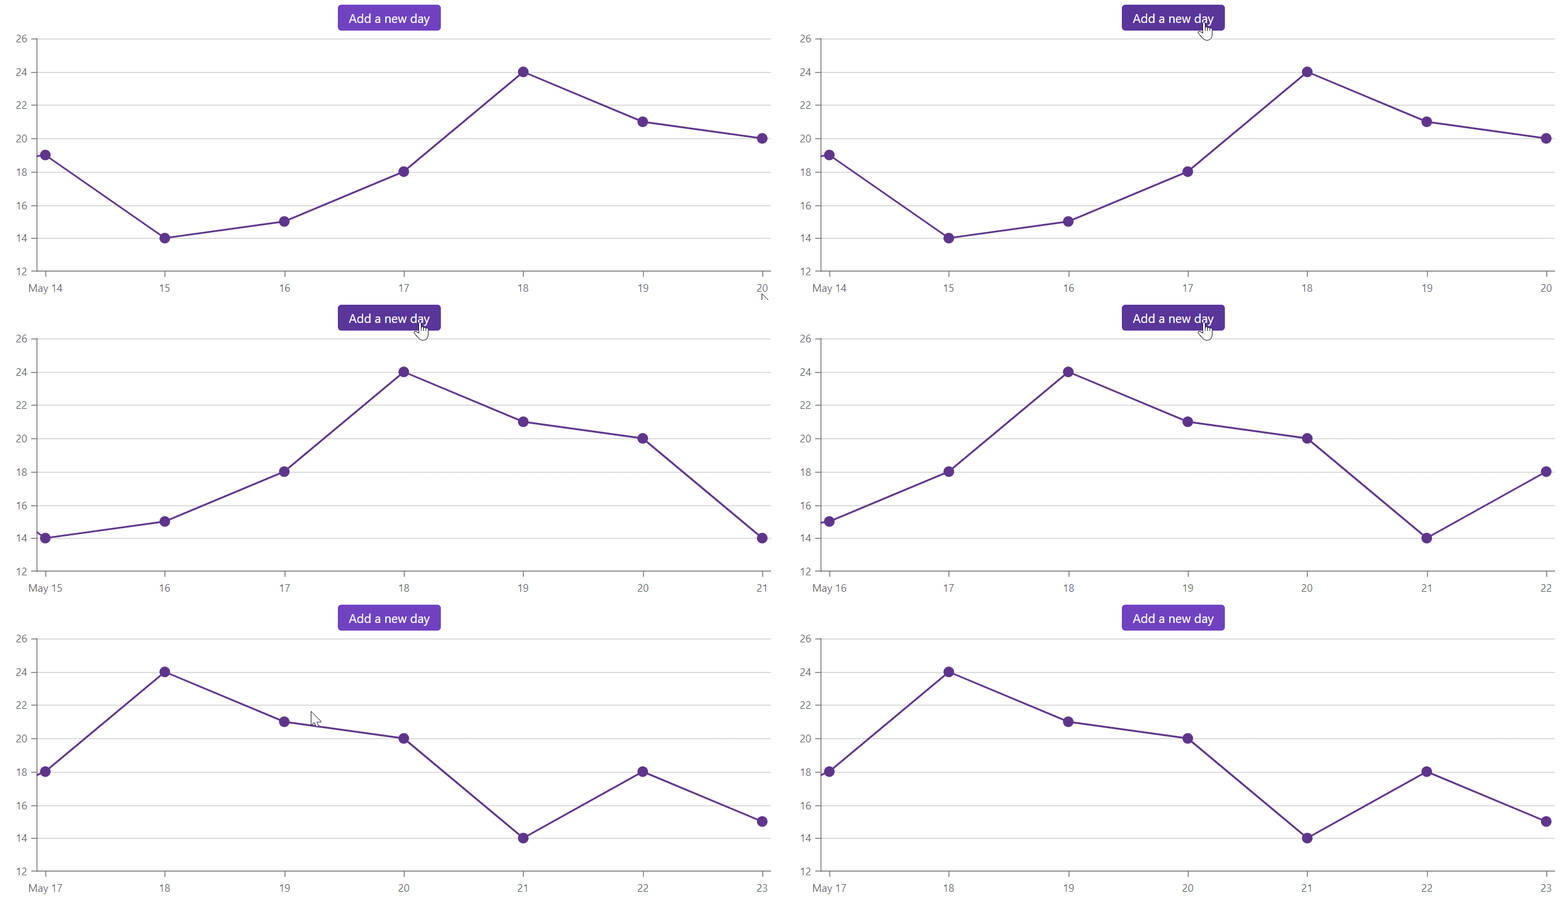
The visual range matches the data range or whole axis length if DxChartAxisRange is defined. Applies to the argument axis only. |
Reset
|
The visual range matches the data range. |
Keep
|
The visual range does not change. |
Auto
|
The range update behavior depends on both the axis type and its visual range. For a detailed explanation of this calculation, refer to the Automatic Range Calculation section. |
Related API Members
The following properties accept/return ChartVisualRangeUpdateMode values:
Remarks
Use the VisualRangeUpdateMode property to specify how the visual range should behave when chart data is updated.
The following code snippet sets the visual range of the argument axis and shifts the range when a new data item is added:
<DxButton Text="Add a new day"
          Click="(e) => GenerateNewItem()">
</DxButton>

<DxChart Data="@DataList" @ref="Chart">
    <DxChartLineSeries T="DailyData"
                       TArgument="DateTime"
                       TValue="int"
                       ArgumentField="@(s => s.Date)"
                       ValueField="@(s => s.Value)" />
    <DxChartArgumentAxis VisualRangeUpdateMode="ChartVisualRangeUpdateMode.Shift">
          <DxChartAxisRange StartValue="new DateTime(2020, 05, 14)"
                            EndValue="new DateTime(2020, 05, 20)" />
    </DxChartArgumentAxis>
    <DxChartLegend Visible="false" />
</DxChart>

@code {
    int DaysNum { get; set; } = 0;
    DxChart<DailyData> Chart;
    static readonly Random random = new Random();

    protected override void OnInitialized() {
        DataList = GetData();
    }

    void GenerateNewItem() {
        DataList.Add(new DailyData() {
            Date = new DateTime(2020, 05, 20).AddDays(++DaysNum),
            Value = random.Next(10, 20)
        });
        Chart.RefreshData();
    }
}

Automatic Range Calculation
When the VisualRangeUpdateMode property is set to ChartVisualRangeUpdateMode.Auto, the axis type determines how the visual range is calculated when chart data is updated.
Argument axis:
- If the visual range is not set, the
ChartVisualRangeUpdateMode.Autois interpreted asChartVisualRangeUpdateMode.Reset. - If only StartValue of the visual range is set, the
ChartVisualRangeUpdateMode.Autois interpreted asChartVisualRangeUpdateMode.Shift. - If the EndValue of the visual range is set, the
ChartVisualRangeUpdateMode.Autois interpreted asChartVisualRangeUpdateMode.Keep.
Value axis:
The ChartVisualRangeUpdateMode.Auto value inherits its behavior from the VisualRangeUpdateMode of the argument axis.
- When the
VisualRangeUpdateModeof the argument axis isChartVisualRangeUpdateMode.ResetorChartVisualRangeUpdateMode.Shift, theChartVisualRangeUpdateMode.Autois interpreted asChartVisualRangeUpdateMode.Reset. - When the
VisualRangeUpdateModeof the argument axis isChartVisualRangeUpdateMode.Keep, theChartVisualRangeUpdateMode.Autois interpreted asChartVisualRangeUpdateMode.Keep.
Tip
To freeze the visual range of the chart, set the VisualRangeUpdateMode of both axes to ChartVisualRangeUpdateMode.Keep.