DxChartSplineAreaSeries<T, TArgument, TValue> Class
Defines a spline area series.
Namespace: DevExpress.Blazor
Assembly: DevExpress.Blazor.v26.1.dll
Declaration
public class DxChartSplineAreaSeries<T, TArgument, TValue> :
    DxChartAreaSeriesBase<T, TArgument, TValue>
Type Parameters
| Name | Description |
|---|---|
| T | The data type. |
| TArgument | The argument type. |
| TValue | The value type. |
Remarks
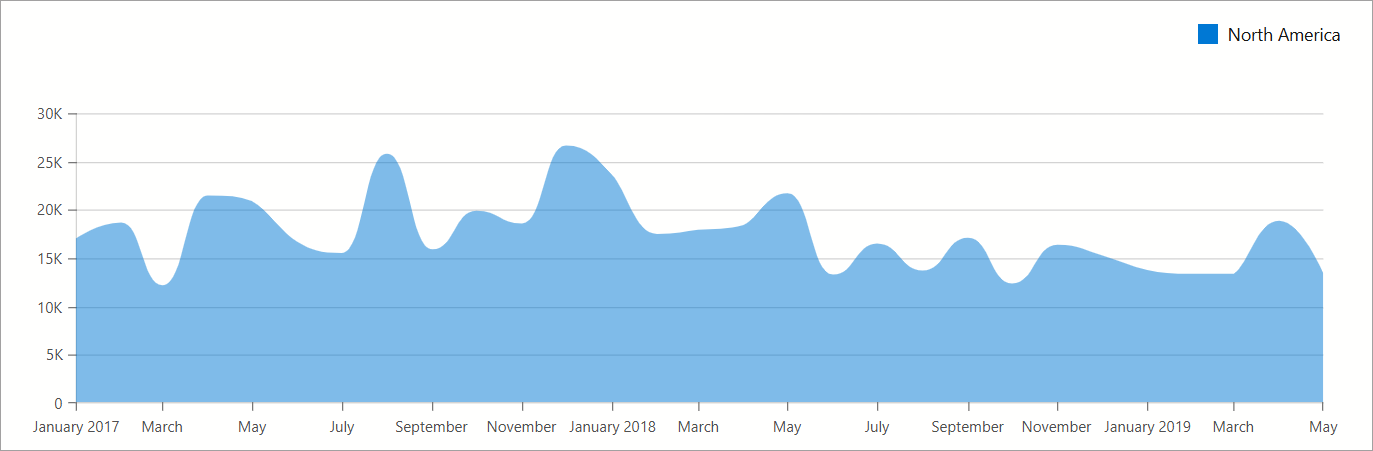
The spline area series displays data as a spline interpolation of the series values. The area between the spline and the argument axis is shaded with a color.
Follow the steps below to create a spline area series:
- Use the DxChart.Data property to specify an IEnumerable<T> data source.
- Add a
DxChartSplineAreaSeriesobject to chart markup. - Use series ArgumentField and ValueField properties to specify data source fields that contain arguments and values for chart points.
For a sample data source, refer to our GitHub repository.
@inject ISalesInfoDataProvider Sales

<DxChart Data="@chartsData"
         Width="100%"
         LabelOverlap="ChartLabelOverlap.Hide">
    <DxChartSplineAreaSeries Name="North America"
                             T="SaleInfo"
                             TArgument="DateTime"
                             TValue="int"
                             ArgumentField="si => new DateTime(si.Date.Year, si.Date.Month, 1)"
                             ValueField="si => si.Amount"
                             SummaryMethod="Enumerable.Sum"
                             Filter='si => si.Region == "North America" '
                             HoverMode="ChartContinuousSeriesHoverMode.None">
        <DxChartSeriesPoint Visible=ShowSeriesPointMarkers
                            HoverMode="ChartSeriesPointHoverMode.None" />
        <DxChartSeriesLabel Visible=ShowSeriesLabels
                            ValueFormat="ChartElementFormat.Thousands(1)" />
    </DxChartSplineAreaSeries>
    <DxChartLegend Position="RelativePosition.Outside"
                   HorizontalAlignment="HorizontalAlignment.Right" />
@* ... *@
</DxChart>
@* ... *@
@code {
    IEnumerable<SaleInfo> chartsData;

    [Parameter] public bool ShowSeriesPointMarkers { get; set; }
    [Parameter] public bool ShowSeriesLabels { get; set; }

    protected override async Task OnInitializedAsync() {
        chartsData = await Sales.GetSalesAsync();
    }
}
Inheritance
Object
ComponentBase
DxSettingsComponent<DevExpress.Blazor.Internal.IXYChartSeriesModel>
DxComplexSettingsComponent<DxChartSeries, DevExpress.Blazor.Internal.IXYChartSeriesModel>
DxChartSeries
DxChartXYSeries<T, TArgument, TValue, TValue>
DxChartAreaSeriesBase<T, TArgument, TValue>
DxChartSplineAreaSeries<T, TArgument, TValue>
See Also