DxPieChartAnnotation Class
Defines a piechart annotation.
Namespace: DevExpress.Blazor
Assembly: DevExpress.Blazor.v26.1.dll
Declaration
public class DxPieChartAnnotation :
    DxChartAnnotationBase<PieChartAnnotationModel>
Remarks
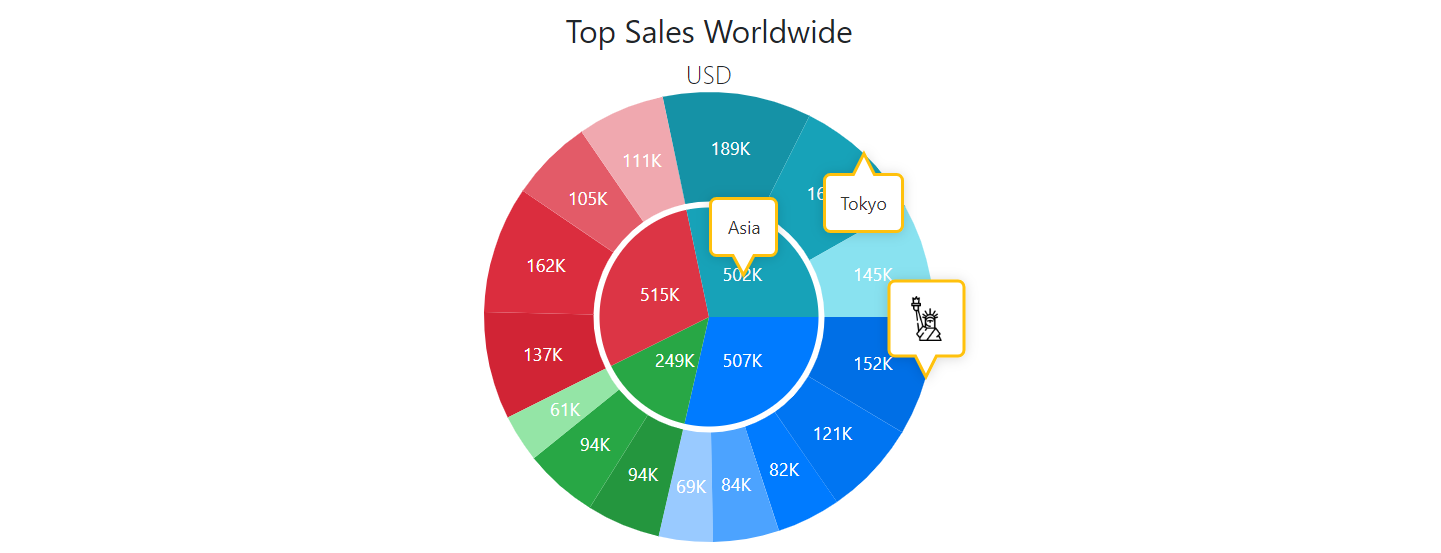
Annotations are comments that contain information about chart content. The DxPieChart<T> component supports text and image annotations. You can anchor annotations to chart elements (series points) or position annotations based on pixel coordinates.
To create an annotation, follow the steps below:
Add a
DxPieChartAnnotationobject to the chart markup.Optional. Customize the annotation size and appearance and configure tooltips.
<DxPieChart Data="@SalesData"
            T="SaleInfo">
    <DxPieChartAnnotation Text="Asia"
                          Argument="@("Asia")"
                          Series="Region Sales"
                          Opacity="1">
        <DxChartAnnotationBorder Color="#FFC107" Width="2" CornerRadius="4" />
    </DxPieChartAnnotation>
    <DxPieChartAnnotation Text="Tokyo"
                          Argument="@("Tokyo")"
                          Series="City Sales"
                          Location="PieChartAnnotationLocation.Edge"
                          Opacity="1">
        <DxChartAnnotationBorder Color="#FFC107" Width="2" CornerRadius="4" />
    </DxPieChartAnnotation>
    <DxPieChartAnnotation Type="ChartAnnotationType.Image"
                          Argument="@("New York")"
                          Series="City Sales"
                          Location="PieChartAnnotationLocation.Edge"
                          Opacity="1">
        <DxChartAnnotationImage Url="https://cdn-icons-png.flaticon.com/512/618/618848.png" />
        <DxChartAnnotationBorder Color="#FFC107" Width="2" CornerRadius="4" />
    </DxPieChartAnnotation>
    <DxPieChartSeries T="SaleInfo"
                      TArgument="string"
                      TValue="double"
                      ValueField="si => si.Amount"
                      ArgumentField="si => si.Region"
                      SummaryMethod="Enumerable.Sum"
                      Name="Region Sales">
        @* ... *@
    </DxPieChartSeries>
    <DxPieChartSeries T="SaleInfo"
                      TArgument="string"
                      TValue="double"
                      ValueField="si => si.Amount"
                      ArgumentField="si => si.City"
                      SummaryMethod="Enumerable.Sum"
                      Name="City Sales">
        @* ... *@
    </DxPieChartSeries>
    <DxChartTitle Text="Top Sales Worldwide">
        <DxChartSubTitle Text="USD" />
    </DxChartTitle>
</DxPieChart>
Refer to the following section for additional information about annotations: Annotations in Blazor Charts.
Inheritance
Object
ComponentBase
DxSettingsComponent<DevExpress.Blazor.Internal.PieChartAnnotationModel>
DxComplexSettingsComponent<DxChartAnnotationBase<DevExpress.Blazor.Internal.PieChartAnnotationModel>, DevExpress.Blazor.Internal.PieChartAnnotationModel>
DxChartAnnotationBase<DevExpress.Blazor.Internal.PieChartAnnotationModel>
DxPieChartAnnotation
See Also