DxChartAxisRange Class
Specifies the axis visual range.
Namespace: DevExpress.Blazor
Assembly: DevExpress.Blazor.v26.1.dll
Declaration
public class DxChartAxisRange :
    DxSettingsComponent<ChartAxisRangeModel>
Remarks
Use a DxChartAxisRange object to define the visual range for an axis (argument or value).
To set the range, use one of the following options:
- Specify both StartValue and EndValue properties.
- Specify Length and StartValue / EndValue properties.
- Specify the Length property only. When you leave StartValue and EndValue properties unspecified, the chart component uses the last axis value as the end value.
Once you define the axis range, you can use one of the following properties to manage the axis:
- EndOnTick
- Specifies whether an axis should start and end on ticks.
- SideMarginsEnabled
- Specifies whether the component should add margins between the outermost series points and the chart boundaries.
Refer to the following section on how to use these properties to manage the axis range: Limit the Visible Range.
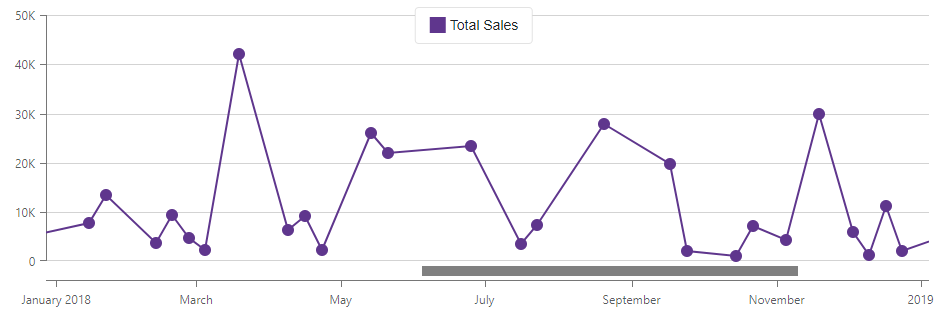
In the following example, the data source contains sales data from 2017 to 2019. After the first render, the Chart shows data for 2018 only. To see the whole plot, users can scroll or drag the chart area. For a sample data source, refer to our GitHub repository.
@using Chart.Data

<DxChart Data="@dataSource">
    <DxChartLineSeries Name="Total Sales" ArgumentField="@((SaleInfo s) => s.Date)"
                       ValueField="@((SaleInfo s) => s.Amount)">
        <DxChartAggregationSettings Enabled="true"
                                    Method="ChartAggregationMethod.Sum" />
    </DxChartLineSeries>
    <DxChartArgumentAxis>
        <DxChartAxisRange StartValue="@(new DateTime(2018, 01, 01))" EndValue="@(new DateTime(2018, 12, 31))" />
    </DxChartArgumentAxis>
    <DxChartZoomAndPanSettings ArgumentAxisZoomAndPanMode="ChartAxisZoomAndPanMode.Pan" />
    <DxChartScrollBarSettings ArgumentAxisScrollBarVisible="true"
                              ArgumentAxisScrollBarPosition="ChartScrollBarPosition.Bottom" />
</DxChart>

@code {
    IEnumerable<SaleInfo> dataSource;

    protected override async Task OnInitializedAsync()
    {
        dataSource = await Sales.GetSalesAsync();
    }
}
To create a Chart that displays a part of the data source’s items, use the Filter property. The latter allows you to increase Chart performance, since the client loads fewer data items.