DxChartAxisMinorTick Class
Stores the appearance settings of minor axis ticks.
Namespace: DevExpress.Blazor
Assembly: DevExpress.Blazor.v26.1.dll
NuGet Package: DevExpress.Blazor
Declaration
public class DxChartAxisMinorTick :
    DxSettingsComponent<ChartAxisMinorTickModel>
Remarks
Use DxChartAxisMinorTick objects to customize settings of minor axis ticks in the following components:
- DxChart<T>
- A control that visualizes bound data as graphs: bar, area, line, and others.
- DxPolarChart<T>
- A control that visualizes bound data as graphs in polar coordinates.
Major ticks divide an axis into sections that mark values on this axis. Minor ticks divide an axis segment between two neighboring major ticks. Minor ticks cannot be displayed on the axis of Discrete type.
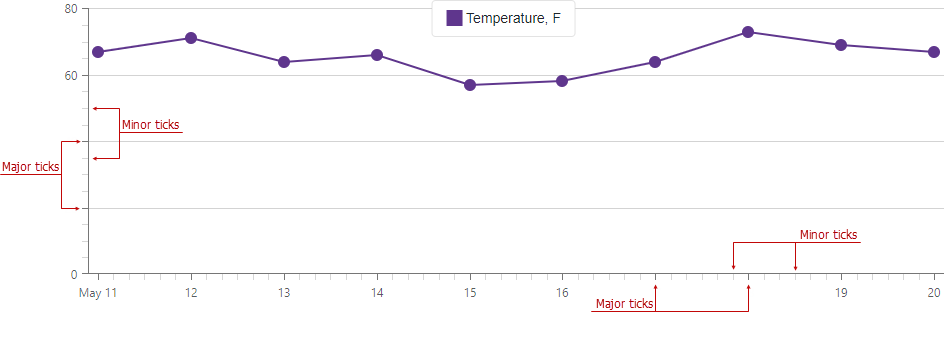
Use the DxChartAxisTick class to customize appearance of major ticks and the DxChartAxisMinorTick class for minor ticks.
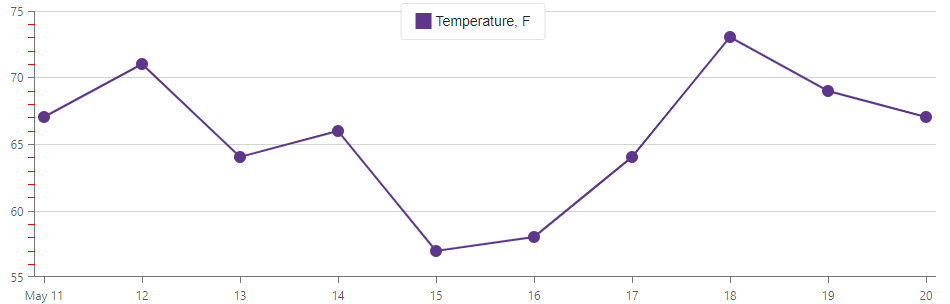
The Chart’s default axes do not show minor ticks. Set the minor tick Visible property to true to make them visible.
You can use the following properties to customize minor tick appearance:
- Color
- Specifies the color of minor ticks.
- Opacity
- Specifies the transparency of minor ticks.
- Shift
- Shifts minor ticks relative to an axis line.
- Length
- Specifies the length of minor ticks.
- Width
- Specifies the width of minor ticks.
You should specify these properties in the component’s markup as shown in the snippet below:
@using Chart.Data
@using System.Drawing;

<DxChart Data="@forecasts">
    <DxChartLineSeries ArgumentField="@((WeatherForecast i) => i.Date)"
                       ValueField="@((WeatherForecast i) => i.TemperatureF)"
                       Name="Temperature, F" />
    <DxChartValueAxis>
        <DxChartAxisMinorTick Visible="true"
                              Color="Color.Red"
                              Opacity="1" />
    </DxChartValueAxis>
</DxChart>
You can also use the following properties to specify how to position minor ticks on an axis:
- MinorTickCount: Specifies the number of minor ticks between two neighboring major ticks.
- MinorTickInterval: Specifies the interval between minor ticks. Applies only to continuous axes.
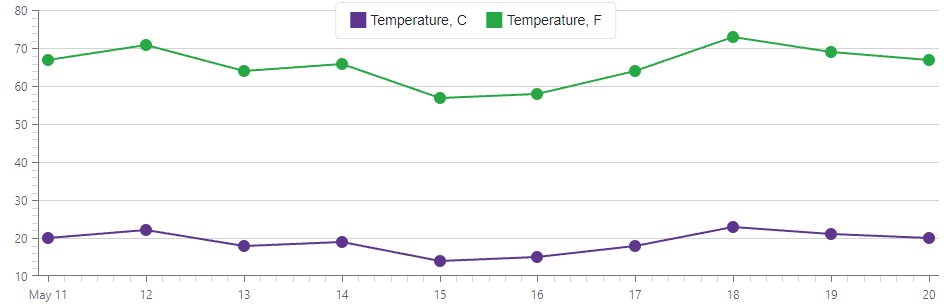
The following example sets the minor tick interval to 2 on the value axis and to 4 hours on the argument axis:
<DxChart Data="@forecasts">
    <DxChartLineSeries ArgumentField="@((WeatherForecast i) => i.Date)"
                       ValueField="@((WeatherForecast i) => i.TemperatureC)"
                       Name="Temperature, C" />
    <DxChartLineSeries ArgumentField="@((WeatherForecast i) => i.Date)"
                       ValueField="@((WeatherForecast i) => i.TemperatureF)"
                       Name="Temperature, F" />
    <DxChartArgumentAxis MinorTickInterval="ChartAxisInterval.Hours(4)">
        <DxChartAxisMinorTick Visible="true" />
    </DxChartArgumentAxis>
    <DxChartValueAxis MinorTickInterval="2">
        <DxChartAxisMinorTick Visible="true" />
    </DxChartValueAxis>
</DxChart>