ChartAxisLabelDisplayMode Enum
Lists values that specify how the chart displays axis labels.
Namespace: DevExpress.Blazor
Assembly: DevExpress.Blazor.v26.1.dll
Declaration
public enum ChartAxisLabelDisplayModeMembers
| Name | Description |
|---|---|
Rotate
|
Rotates axis labels at the angle specified by the RotationAngle property. |
Stagger
|
Arranges axis labels in two staggered rows. Use the StaggeringSpacing property to specify the empty space between rows. |
Standard
|
Does not change the default arrangement of axis labels. |
Related API Members
The following properties accept/return ChartAxisLabelDisplayMode values:
Remarks
Use the DisplayMode property to specify how the chart displays axis labels. Note that this property value applies to horizontal axes only.
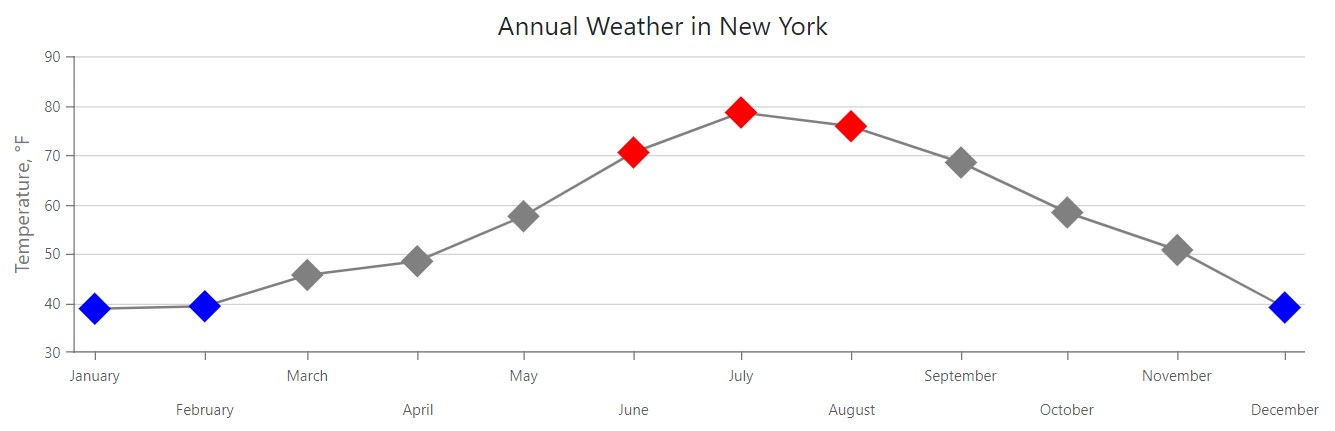
The following example arranges axis labels in two staggered rows:
<DxChart Data="@WeatherForecasts">
    <DxChartTitle Text="Annual Weather in New York" />
    <DxChartLineSeries SummaryMethod="@(i => i.Average())"
                       Color="@Color.Gray"
                       ValueField="@((DetailedWeatherSummary i) => i.AverageTemperatureF)"
                       ArgumentField="@(i => new DateTime(2000, i.Date.Month, 1))"
                       Name="Temperature, °F"
                       Filter="@((DetailedWeatherSummary  i) => i.City == "NEW YORK")">
        @* ... *@
    </DxChartLineSeries>
    <DxChartLegend Visible="false" />
    <DxChartValueAxis>
        <DxChartAxisTitle Text="Temperature, °F" />
    </DxChartValueAxis>
    <DxChartArgumentAxis>
        <DxChartAxisLabel Format="ChartElementFormat.Month"
                          DisplayMode="ChartAxisLabelDisplayMode.Stagger"
                          StaggeringSpacing="10" />
    </DxChartArgumentAxis>
</DxChart>
See Also