DxChartSeriesLabelBorder Class
Defines series label border settings.
Namespace: DevExpress.Blazor
Assembly: DevExpress.Blazor.v26.1.dll
Declaration
public class DxChartSeriesLabelBorder :
    DxSettingsComponent<ChartSeriesLabelBorderModel>
Remarks
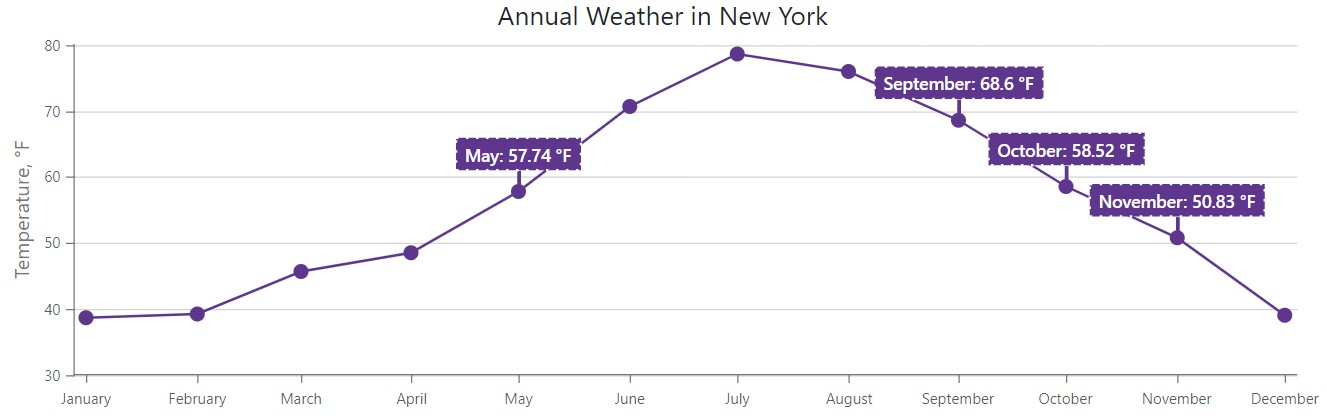
The DxChartSeriesLabelBorder component allows you to configure borders for series labels (DxChartSeriesLabel).
To display borders in the DxChartSeriesLabel component, enable the Visible property. To customize label border appearance, specify the following properties:
The following example shows series label borders and changes their appearance:
<DxChart Data="@WeatherForecasts"
         CustomizeSeriesPoint="@PreparePointLabel"
         Width="100%">
    <DxChartTitle Text="Annual Weather in New York" />
    <DxChartLineSeries SummaryMethod="@(i => i.Average())"
                       ValueField="@((DetailedWeatherSummary i) => i.AverageTemperatureF)"
                       ArgumentField="@(i => new DateTime(2000, i.Date.Month, 1))"
                       Name="Temperature, F"
                       Filter="@((DetailedWeatherSummary  i) => i.City == "NEW YORK")">
        <DxChartSeriesLabel Position="RelativePosition.Outside"
                            FormatPattern="{argument:MMMM}: {value:#.##} °F">
            <DxChartSeriesLabelBorder Visible="true"
                                      DashStyle="ChartDashStyle.Dot"
                                      Color="white"
                                      Width="2" />
            <DxChartSeriesLabelConnector Visible="true"
                                         Width="3" />
            <DxChartFont Size="14" Weight="600"/>
        </DxChartSeriesLabel>
    </DxChartLineSeries>
    <DxChartLegend Visible="false" />
    <DxChartValueAxis>
        <DxChartAxisTitle Text="Temperature, °F" />
    </DxChartValueAxis>
    <DxChartArgumentAxis>
        <DxChartAxisLabel Format="ChartElementFormat.Month" />
    </DxChartArgumentAxis>
</DxChart>


@code {
    IEnumerable<DetailedWeatherSummary> WeatherForecasts;

    protected override async Task OnInitializedAsync() {
        WeatherForecasts = await WeatherSummaryDataProvider.GetDataAsync();
    }

    protected void PreparePointLabel(ChartSeriesPointCustomizationSettings pointSettings) {
        double value = (double)pointSettings.Point.Value;
        if (value > 50 && value < 70)
            pointSettings.PointLabel.Visible = true;
    }
}
Inheritance
Object
ComponentBase
DxSettingsComponent<DevExpress.Blazor.Internal.ChartSeriesLabelBorderModel>
DxChartSeriesLabelBorder
See Also