ChartAxisLabelOverlap Enum
Lists values that specify how a chart displays axis labels if they overlap.
Namespace: DevExpress.Blazor
Assembly: DevExpress.Blazor.v26.1.dll
Declaration
public enum ChartAxisLabelOverlapMembers
| Name | Description |
|---|---|
Rotate
|
Rotates axis labels at the angle specified by the RotationAngle property. |
Stagger
|
Arranges axis labels in two rows in a staggered manner. Use the StaggeringSpacing property to specify the empty space between rows. |
None
|
Leaves axis labels overlapped. |
Hide
|
Hides overlapping axis labels. |
Related API Members
The following properties accept/return ChartAxisLabelOverlap values:
Remarks
Use the Overlap property to specify how the chart displays overlapping axis labels. Note that Hide and None values apply to both horizontal and vertical axes while Rotate and Stagger values apply to horizontal axes only.
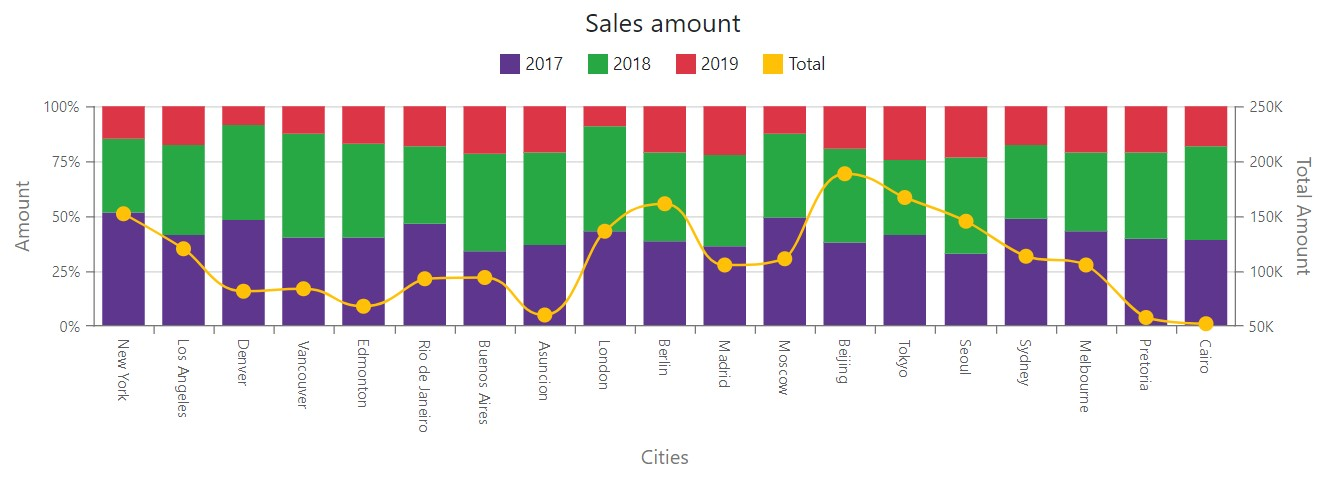
The following example rotates labels of the horizontal axis at the specified angle:
<DxChart Data="SalesData">
    <DxChartTitle Text="Sales amount" />
    <DxChartLegend Position="RelativePosition.Outside" />
    <DxChartArgumentAxis>
        <DxChartAxisTitle Text="Cities" />
        <DxChartAxisLabel Overlap="ChartAxisLabelOverlap.Rotate"
                          RotationAngle="90" />
    </DxChartArgumentAxis>
    @* ... *@
    <DxChartFullStackedBarSeries Name="2017"
                                 Filter="@((SaleInfo s) => s.Date.Year == 2017)"
                                 SummaryMethod="Enumerable.Sum"
                                 ArgumentField="@(s => s.City)"
                                 ValueField="@(s => s.Amount)" />
    <DxChartFullStackedBarSeries Name="2018"
                                 Filter="@((SaleInfo s) => s.Date.Year == 2018)"
                                 SummaryMethod="Enumerable.Sum"
                                 ArgumentField="@(s => s.City)"
                                 ValueField="@(s => s.Amount)" />
    <DxChartFullStackedBarSeries Name="2019"
                                 Filter="@((SaleInfo s) => s.Date.Year == 2019)"
                                 SummaryMethod="Enumerable.Sum"
                                 ArgumentField="@(s => s.City)"
                                 ValueField="@(s => s.Amount)" />
    <DxChartSplineSeries Name="Total"
                         SummaryMethod="Enumerable.Sum"
                         ArgumentField="@((SaleInfo s) => s.City)"
                         ValueField="@(s => s.Amount)"
                         Axis="TotalAxis" />
</DxChart>