IChartSeriesLabelBorder Interface
Contains label border settings.
Namespace: DevExpress.Blazor
Assembly: DevExpress.Blazor.v26.1.dll
Declaration
public interface IChartSeriesLabelBorderRelated API Members
The following members return IChartSeriesLabelBorder objects:
Remarks
Use the Border property in a CustomizeSeriesPoint event handler to access and modify the following border settings:
- Visible
- Allows you to hide or display label borders.
- Color
- Specifies the border color.
- DashStyle | Width
- Allow you to customize style and width of the border line.
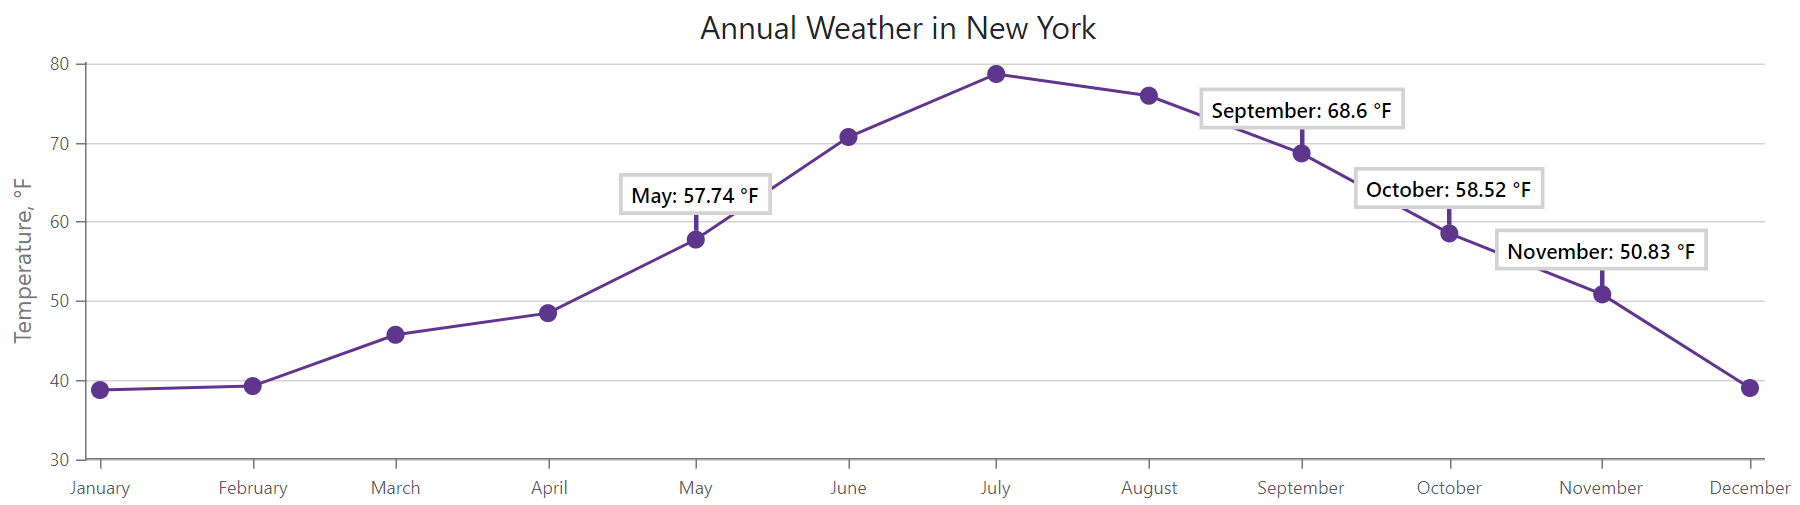
Example
The following code snippet configures border settings of visible point labels:
<DxChart Data="@WeatherForecasts"
         CustomizeSeriesPoint="@PreparePointLabel"
         Width="100%">
    <DxChartTitle Text="Annual Weather in New York" />
    <DxChartLineSeries SummaryMethod="@(i => i.Average())"
                        ValueField="@((DetailedWeatherSummary i) => i.AverageTemperatureF)"
                        ArgumentField="@(i => new DateTime(2000, i.Date.Month, 1))"
                        Name="Temperature, F"
                        Filter="@((DetailedWeatherSummary  i) => i.City == "NEW YORK")">
        <DxChartSeriesLabel Position="RelativePosition.Outside"
                            FormatPattern="{argument:MMMM}: {value:#.##} °F">
            <DxChartSeriesLabelConnector Visible="true"
                                            Width="3" />
            <DxChartFont Size="14" Weight="600"/>
        </DxChartSeriesLabel>
    </DxChartLineSeries>
    @* ... *@
</DxChart>

@code {
    WeatherForecast[] WeatherForecasts;
    // ...

    protected void PreparePointLabel(ChartSeriesPointCustomizationSettings pointSettings) {
        double value = (double)pointSettings.Point.Value;
        if (value > 50 && value < 70)
            pointSettings.PointLabel.Visible = true;
            // ...
            pointSettings.PointLabel.Border.Visible = true;
            pointSettings.PointLabel.Border.Width = 2.5;
    }
}
See Also