DxChartStockSeries<T, TArgument, TValue> Class
Defines a stock bar series.
Namespace: DevExpress.Blazor
Assembly: DevExpress.Blazor.v26.1.dll
Declaration
public class DxChartStockSeries<T, TArgument, TValue> :
    DxChartFinancialSeriesBase<T, TArgument, TValue>
Type Parameters
| Name | Description |
|---|---|
| T | The type of data. |
| TArgument | The type of arguments. |
| TValue | The type of values. |
Remarks
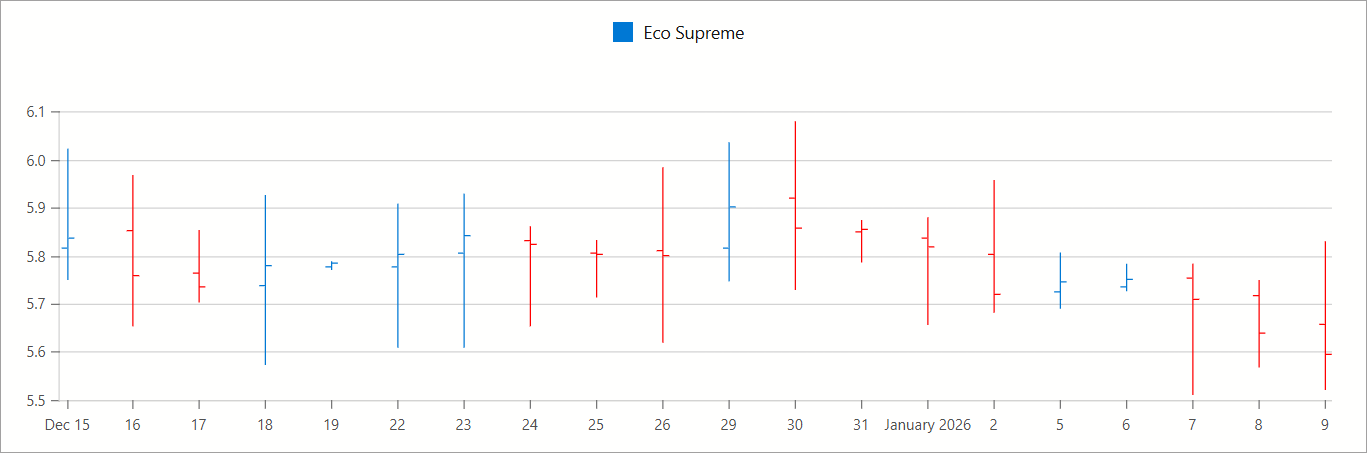
Use a stock series to display the Open-High-Low-Close price data. A set of values with the same associated argument is aggregated into one point. The first value in the set is considered to be Open Value, the last value is Close Value, maximum and minimum values define High and Low values.
Each stock series point is displayed as a vertical line with two tick marks. The vertical line’s bottom and top values define the high and low prices. The left and right tick marks define the open and close prices.
The DxChart component compares each point in a financial series to the previous point. You can use the DxChartFinancialReduction object to highlight points where values decreases.
@inject IFinancialSeriesDataProvider FinancialSeriesDataProvider

<DxChart Data="@stockData"
         Width="100%">

    <DxChartLegend Position="RelativePosition.Outside" />

    <DxChartStockSeries OpenField="(StockDataPoint sdp) => sdp.Open"
                        HighField="sdp => sdp.High"
                        LowField="sdp => sdp.Low"
                        CloseField="sdp => sdp.Close"
                        ArgumentField="@(sdp => new DateTime(
                                        sdp.DateTimeStamp.Year,
                                        sdp.DateTimeStamp.Month,
                                        sdp.DateTimeStamp.Day,
                                        sdp.DateTimeStamp.Hour,
                                        sdp.DateTimeStamp.Minute,
                                        0) )"
                        Name="Eco Supreme" />

    <DxChartArgumentAxis WorkdaysOnly="true"
                         TickInterval="ChartAxisInterval.Days(1)" />
    @* ... *@
</DxChart>

@code {
    IEnumerable<StockDataPoint> stockData;
    // ...
    protected override async Task OnInitializedAsync() {
        stockData = await FinancialSeriesDataProvider.GenerateByDays();
    }
}