DxChart<T>.Rotated Property
Specifies whether the chart is rotated.
Namespace: DevExpress.Blazor
Assembly: DevExpress.Blazor.v26.1.dll
Declaration
[Parameter]
public bool Rotated { get; set; }
Property Value
| Type | Description |
|---|---|
| Boolean |
|
Remarks
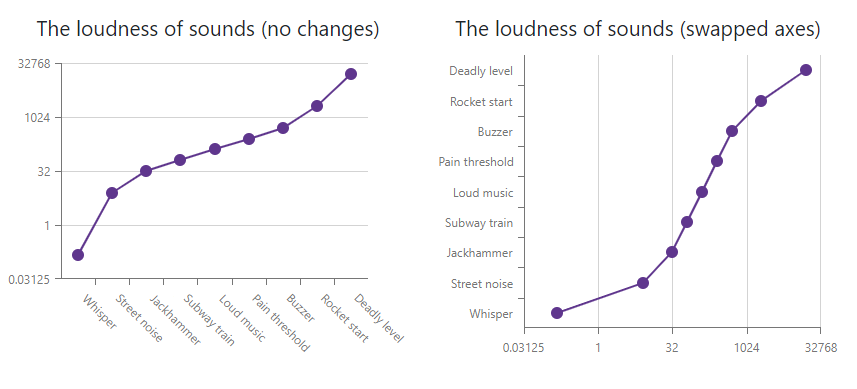
Set the Rotated property to true to swap the argument (X) and value (Y) axes and display the X-axis vertically and the Y-axis horizontally. This property does not change axis functionality (the argument axis is still the X-axis, and the value axis is still the Y-axis).
The following example creates two charts, binds them to the same data source, and rotates the second chart:
<DxChart Data="@GetData()">
    <DxChartTitle Text="The loudness of sounds (no changes)" />
    <DxChartLegend Visible="false" />
    <DxChartArgumentAxis Type="ChartAxisType.Discrete" />
    <DxChartValueAxis Type="ChartAxisType.Logarithmic"
                      LogarithmBase="2" />
    <DxChartLineSeries ArgumentField="@((DataPoint s) => s.Argument)"
                       ValueField="@((DataPoint s) => s.Value)" />
</DxChart>
<DxChart Data="@GetData()" Rotated="true">
    <DxChartTitle Text="The loudness of sounds (swapped axes)" />
    <DxChartLegend Visible="false" />
    <DxChartArgumentAxis Type="ChartAxisType.Discrete" />
    <DxChartValueAxis Type="ChartAxisType.Logarithmic"
                      LogarithmBase="2" />
    <DxChartLineSeries ArgumentField="@((DataPoint s) => s.Argument)"
                       ValueField="@((DataPoint s) => s.Value)" />
</DxChart>
See Also