DxChartSeriesPoint Class
Contains settings for points of the chart’s line- and area-based series.
Namespace: DevExpress.Blazor
Assembly: DevExpress.Blazor.v26.1.dll
Declaration
public class DxChartSeriesPoint :
    DxComplexSettingsComponent<DxChartSeriesPoint, ChartSeriesPointModel>,
    IModelProvider<ChartSeriesPointImageModel>
Remarks
Use the DxChartSeriesPoint component to customize point settings for line series. You can specify the point color, size, symbol, and visibility. These settings apply to all the points in the series.
Handle the chart’s CustomizeSeriesPoint event to override appearance settings for individual points.
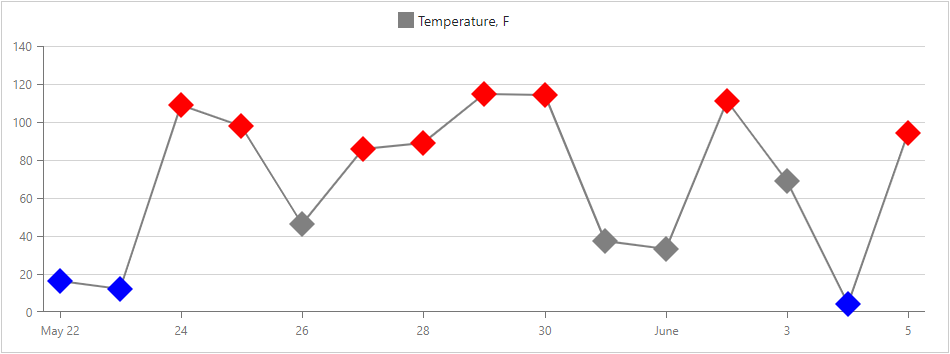
The following example demonstrates how to:
- Define common point appearance.
- Change the color for points whose values are greater than 75 or less than 25;
- Change the point’s hover mode.
<DxChart Data="@WeatherForecasts" CustomizeSeriesPoint="@PreparePointColor">
    <DxChartLineSeries SummaryMethod="@(i => (int)i.Average())"
                       Color="@System.Drawing.Color.Gray"
                       ValueField="@((WeatherForecast i) => i.TemperatureF)"
                       ArgumentField="@(i => i.Date.Date)"
                       Name="Temperature, F">
        <DxChartSeriesPoint Symbol="ChartPointSymbol.Polygon" Color="@System.Drawing.Color.Gray" Size="25" HoverMode="ChartSeriesPointHoverMode.Point"/>
    </DxChartLineSeries>
    <DxChartLegend Position="RelativePosition.Outside" />
</DxChart>

@code {
    WeatherForecast[] WeatherForecasts;
    ...
    protected void PreparePointColor(ChartSeriesPointCustomizationSettings pointSettings) {
        double value = (double)pointSettings.Point.Value;
        if(value > 75)
            pointSettings.PointAppearance.Color = System.Drawing.Color.Red;
        else if(value < 25)
            pointSettings.PointAppearance.Color = System.Drawing.Color.Blue;
    }
}
Inheritance
Object
ComponentBase
DxSettingsComponent<DevExpress.Blazor.Internal.ChartSeriesPointModel>
DxComplexSettingsComponent<DxChartSeriesPoint, DevExpress.Blazor.Internal.ChartSeriesPointModel>
DxChartSeriesPoint
See Also