IChartSeriesLabel.Visible Property
Specifies the label visibility state.
Namespace: DevExpress.Blazor
Assembly: DevExpress.Blazor.v26.1.dll
Declaration
[DefaultValue(false)]
bool Visible { get; set; }
Property Value
| Type | Default | Description |
|---|---|---|
| Boolean | false |
|
Remarks
IChartSeriesLabel properties allow you to configure point label settings. To access these settings, use the PointLabel property in a CustomizeSeriesPoint event handler.
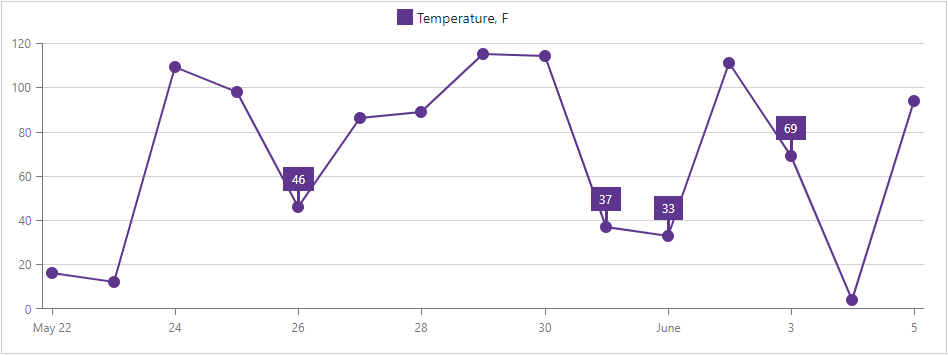
The following example demonstrates how to:
- use the
DxChartSeriesLabelcomponent to specify the position of all labels; - use the DxChartSeriesLabelConnector component to customize connectors between data points and labels;
- handle the
CustomizeSeriesPointevent to show only labels whose values are between 25 and 75.
@inject WeatherForecastService ForecastService

<DxChart Data="@ChartData" CustomizeSeriesPoint="@PreparePointLabel">
    <DxChartLineSeries SummaryMethod="@(i => (int)i.Average())"
                       ValueField="@((WeatherForecast i) => i.TemperatureF)"
                       ArgumentField="@(i => i.Date.Date)"
                       Name="Temperature, F">
        <DxChartSeriesLabel Position="RelativePosition.Outside">
            <DxChartSeriesLabelConnector Visible="true" Width="3" />
        </DxChartSeriesLabel>
    </DxChartLineSeries>
</DxChart>

@code {
    WeatherForecast[] ChartData;

    protected override async Task OnInitializedAsync() {
        ChartData = await ForecastService.GetForecastAsync();
    }

    protected void PreparePointLabel(ChartSeriesPointCustomizationSettings pointSettings) {
        double value = (double)pointSettings.Point.Value;
        if (value > 25 && value < 75)
            pointSettings.PointLabel.Visible = true;
    }
}
See Also