IChartSeriesLabel.Alignment Property
Specifies the horizontal alignment of series labels.
Namespace: DevExpress.Blazor
Assembly: DevExpress.Blazor.v26.1.dll
Declaration
[DefaultValue(HorizontalAlignment.Center)]
HorizontalAlignment Alignment { get; set; }
Property Value
| Type | Default | Description |
|---|---|---|
| HorizontalAlignment | Center | An enumeration value. |
Available values:
| Name | Description |
|---|---|
| Center | Center alignment. |
| Left | Left alignment. |
| Right | Right alignment. |
Remarks
IChartSeriesLabel properties allow you to configure point label settings. To access these settings, use the PointLabel property in a CustomizeSeriesPoint event handler.
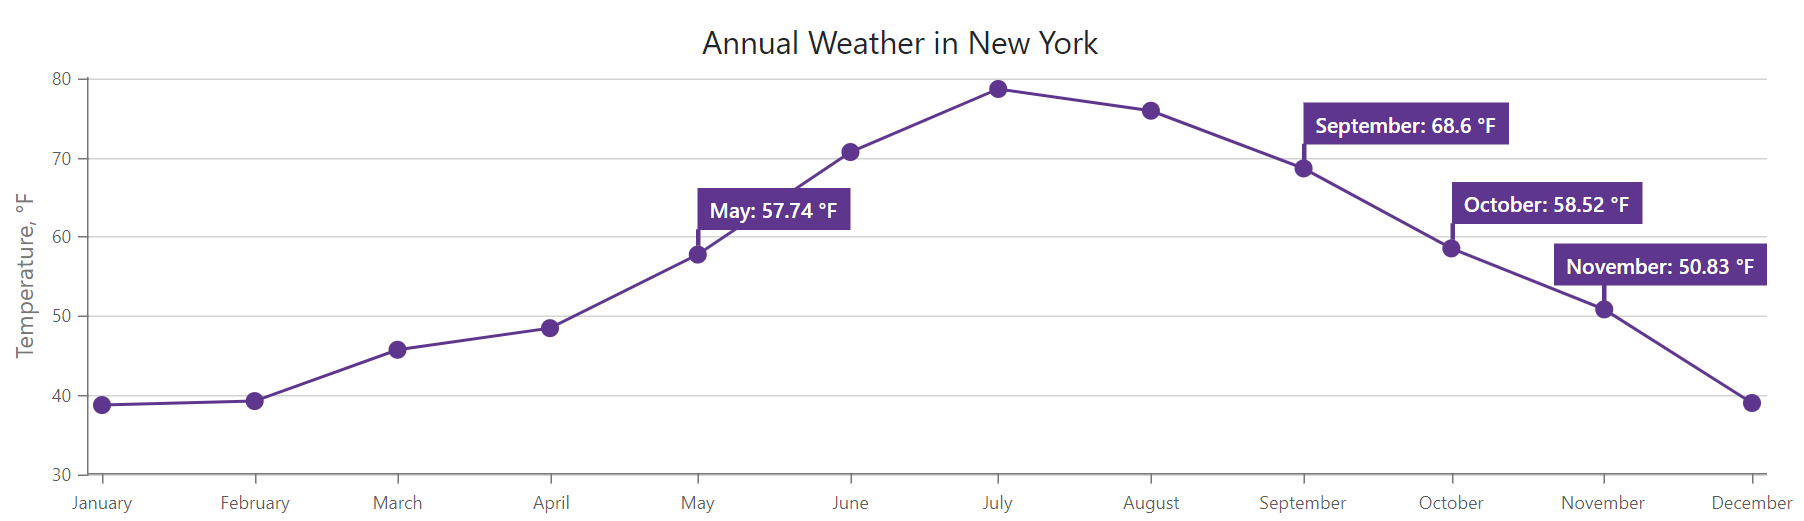
The Alignment property allows you to align series labels relative to corresponding series points. Center, Left, and Right alignment options are available.
Example
The following code snippet changes the alignment of visible series labels:
<DxChart Data="@WeatherForecasts"
         CustomizeSeriesPoint="@PreparePointLabel"
         Width="100%">
    <DxChartTitle Text="Annual Weather in New York" />
    <DxChartLineSeries SummaryMethod="@(i => i.Average())"
                        ValueField="@((DetailedWeatherSummary i) => i.AverageTemperatureF)"
                        ArgumentField="@(i => new DateTime(2000, i.Date.Month, 1))"
                        Name="Temperature, F"
                        Filter="@((DetailedWeatherSummary  i) => i.City == "NEW YORK")">
        <DxChartSeriesLabel Position="RelativePosition.Outside"
                            FormatPattern="{argument:MMMM}: {value:#.##} °F">
            <DxChartSeriesLabelConnector Visible="true"
                                            Width="3" />
            <DxChartFont Size="14" Weight="600"/>
        </DxChartSeriesLabel>
    </DxChartLineSeries>
    @* ... *@
</DxChart>

@code {
    WeatherForecast[] WeatherForecasts;
    // ...

    protected void PreparePointLabel(ChartSeriesPointCustomizationSettings pointSettings) {
        double value = (double)pointSettings.Point.Value;
        if (value > 50 && value < 70)
            pointSettings.PointLabel.Visible = true;
            pointSettings.PointLabel.Alignment = HorizontalAlignment.Left;
    }
}
See Also