DxChartBase.CustomizeSeriesPoint Event
Allows you to customize series points, pie sectors, and their labels.
Namespace: DevExpress.Blazor
Assembly: DevExpress.Blazor.v26.1.dll
NuGet Package: DevExpress.Blazor
Declaration
[Parameter]
public Action<ChartSeriesPointCustomizationSettings> CustomizeSeriesPoint { get; set; }
Parameters
| Type | Description |
|---|---|
| ChartSeriesPointCustomizationSettings | An argument that stores information for this event. |
Remarks
The CustomizeSeriesPoint event occurs for each data point or pie sector in all chart series.
Use the event argument’s Point property to access the current point’s settings. The Point.Value and Point.Argument properties define the actual value and argument, and the Point.SeriesName property identifies the series to which the point belongs. The Point.DataItems property returns all items from the chart’s data source.
Customize Series Points
Handle the CustomizeSeriesPoint event to customize individual points in a line series or pie series. Use the event argument’s PointAppearance property to specify the color, size, symbol, and visibility state of points.
To specify appearance settings that apply to all points in a line series, use the DxChartSeriesPoint component.
Tip
Individual point settings take priority over common point settings.
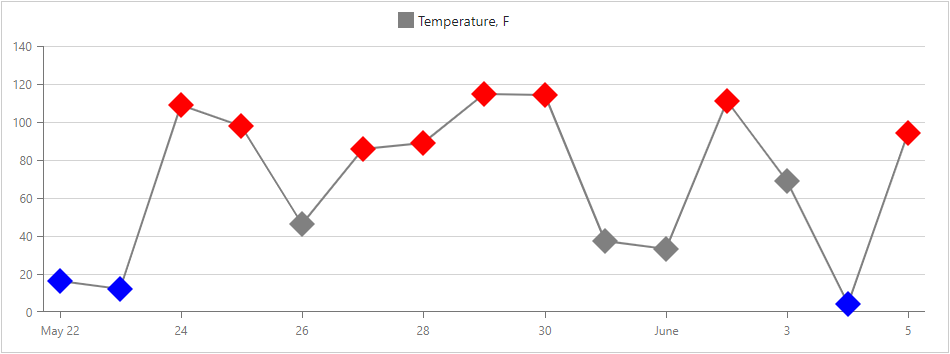
The following example demonstrates how to:
- use the DxChartSeriesPoint component to define the common point appearance;
- handle the
CustomizeSeriesPointevent to change the color of points whose values are greater than 75 or less than 25.
@inject WeatherForecastService ForecastService

<DxChart Data="@ChartData" CustomizeSeriesPoint="@PreparePointColor">
    <DxChartLineSeries SummaryMethod="@(i => (int)i.Average())"
                       Color="@System.Drawing.Color.Gray"
                       ValueField="@((WeatherForecast i) => i.TemperatureF)"
                       ArgumentField="@(i => i.Date.Date)"
                       Name="Temperature, F">
        <DxChartSeriesPoint Symbol="ChartPointSymbol.Polygon" Color="@System.Drawing.Color.Gray" Size="25" />
    </DxChartLineSeries>
</DxChart>

@code {
    WeatherForecast[] ChartData;

    protected override async Task OnInitializedAsync() {
        ChartData = await ForecastService.GetForecastAsync();
    }

    protected void PreparePointColor(ChartSeriesPointCustomizationSettings pointSettings) {
        double value = (double)pointSettings.Point.Value;
        if (value > 75)
            pointSettings.PointAppearance.Color = System.Drawing.Color.Red;
        else if (value < 25)
            pointSettings.PointAppearance.Color = System.Drawing.Color.Blue;
    }
}
Similarly, you can handle the CustomizeSeriesPoint event for the pie series. The following example handles the CustomizeSeriesPoint event to change the color of points whose values are less than 3000.
<DxPieChart Data="@SalesData" CustomizeSeriesPoint="@PreparePointColor">
    <DxPieChartSeries T="SaleInfo"
                      TArgument="string"
                      TValue="double"
                      ValueField="si => si.Amount"
                      ArgumentField="si => si.City">
    </DxPieChartSeries>
    <DxChartLegend Visible="false" />
</DxPieChart>

@code {
  @* ... *@
  protected void PreparePointColor(ChartSeriesPointCustomizationSettings pointSettings)
  {
      double value = (double)pointSettings.Point.Value;
      if (value < 3000)
        pointSettings.PointAppearance.Color = System.Drawing.Color.Gray;
  }
}

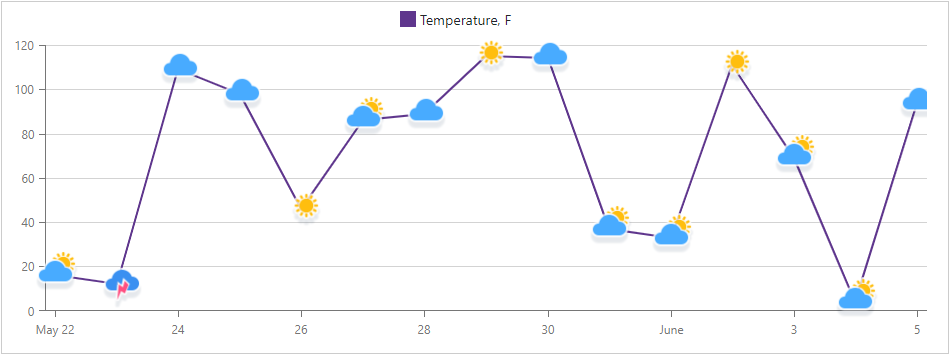
You can also specify custom images for series points. The following example illustrates how to:
- use the DxChartSeriesPointImage component to specify the image size common for all points;
- handle the
CustomizeSeriesPointevent and use the PointAppearance.Image property to assign images to individual points.
Point images are specified based on the CloudCover field value, which comes from the chart’s data source. Images with corresponding names are stored in the wwwroot/images folder.
<DxChart Data="@WeatherForecasts" CustomizeSeriesPoint="@PreparePointImage">
    <DxChartLineSeries SummaryMethod="@(i => (int)i.Average())"
                       ValueField="@((WeatherForecast i) => i.TemperatureF)"
                       ArgumentField="@(i => i.Date.Date)"
                       Name="Temperature, F">
        <DxChartSeriesPoint>
            <DxChartSeriesPointImage Width="50" Height="50" />
        </DxChartSeriesPoint>
    </DxChartLineSeries>
    <DxChartLegend Position="RelativePosition.Outside" />
</DxChart>

@code {
    WeatherForecast[] WeatherForecasts;
    // ...
    protected void PreparePointImage(ChartSeriesPointCustomizationSettings pointSettings) {
        IEnumerable<WeatherForecast> dataItems = pointSettings.Point.DataItems.Cast<WeatherForecast>();
        var weatherType = dataItems.GroupBy(x => x.CloudCover).OrderByDescending(x => x.Count()).First().Key;
        pointSettings.PointAppearance.Image.Url = $"images/{weatherType}.png";
    }
}
Customize Series Labels
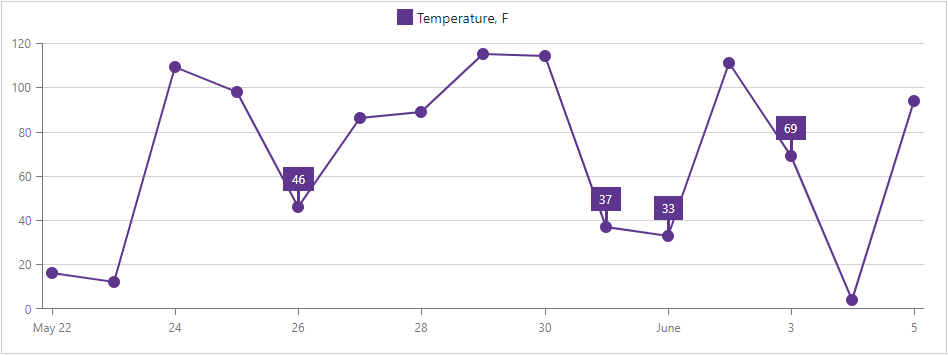
The CustomizeSeriesPoint event allows you to customize individual labels in any series. Use the event argument’s PointLabel property to specify the background color, position, and visibility state of labels.
To define appearance settings common for all labels in a series, use the DxChartSeriesLabel component.
Tip
Individual label settings take priority over common label settings.
The following example demonstrates how to:
- use the
DxChartSeriesLabelcomponent to specify the position of all labels; - use the DxChartSeriesLabelConnector component to customize connectors between data points and labels;
- handle the
CustomizeSeriesPointevent to show only labels whose values are between 25 and 75.
@inject WeatherForecastService ForecastService

<DxChart Data="@ChartData" CustomizeSeriesPoint="@PreparePointLabel">
    <DxChartLineSeries SummaryMethod="@(i => (int)i.Average())"
                       ValueField="@((WeatherForecast i) => i.TemperatureF)"
                       ArgumentField="@(i => i.Date.Date)"
                       Name="Temperature, F">
        <DxChartSeriesLabel Position="RelativePosition.Outside">
            <DxChartSeriesLabelConnector Visible="true" Width="3" />
        </DxChartSeriesLabel>
    </DxChartLineSeries>
</DxChart>

@code {
    WeatherForecast[] ChartData;

    protected override async Task OnInitializedAsync() {
        ChartData = await ForecastService.GetForecastAsync();
    }

    protected void PreparePointLabel(ChartSeriesPointCustomizationSettings pointSettings) {
        double value = (double)pointSettings.Point.Value;
        if (value > 25 && value < 75)
            pointSettings.PointLabel.Visible = true;
    }
}