DxChartSeriesLabelBorder.DashStyle Property
Specifies the line style for series label borders.
Namespace: DevExpress.Blazor
Assembly: DevExpress.Blazor.v26.1.dll
Declaration
[DefaultValue(ChartDashStyle.Solid)]
[Parameter]
public ChartDashStyle DashStyle { get; set; }
Property Value
| Type | Default | Description |
|---|---|---|
| ChartDashStyle | Solid | A ChartDashStyle enumeration value. |
Available values:
| Name | Description |
|---|---|
| Solid | A continuous solid line. |
| Dash | A dashed line. |
| Dot | A dotted line. |
| LongDash | A line that displays long dashes. |
| DashDot | A line that repeats the dash-dot pattern. |
| DashDotDot | A line that repeats the dash-dot-dot pattern. |
Remarks
To display borders in the DxChartSeriesLabel component, enable the Visible property.
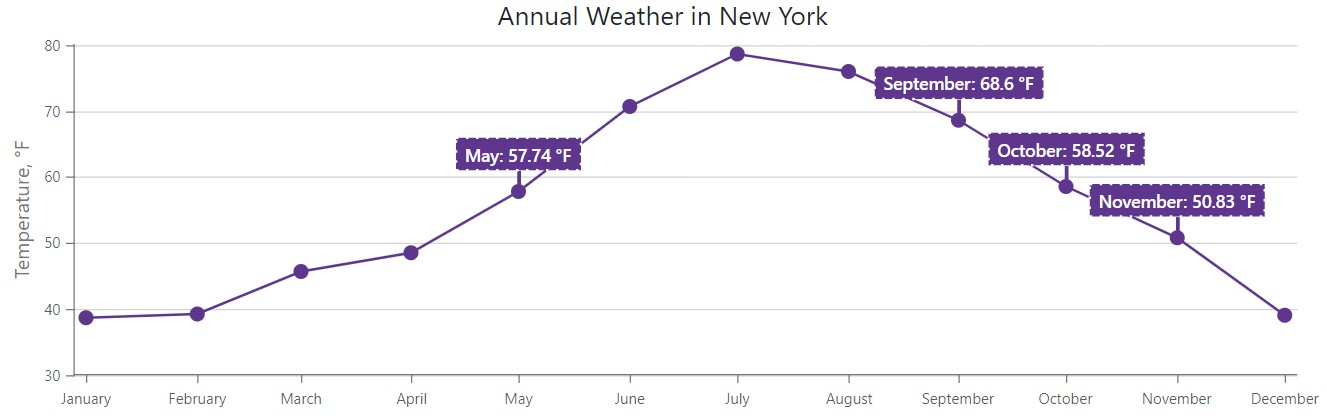
The following example shows series label borders and changes their appearance:
<DxChart Data="@WeatherForecasts"
         CustomizeSeriesPoint="@PreparePointLabel"
         Width="100%">
    <DxChartTitle Text="Annual Weather in New York" />
    <DxChartLineSeries SummaryMethod="@(i => i.Average())"
                       ValueField="@((DetailedWeatherSummary i) => i.AverageTemperatureF)"
                       ArgumentField="@(i => new DateTime(2000, i.Date.Month, 1))"
                       Name="Temperature, F"
                       Filter="@((DetailedWeatherSummary  i) => i.City == "NEW YORK")">
        <DxChartSeriesLabel Position="RelativePosition.Outside"
                            FormatPattern="{argument:MMMM}: {value:#.##} °F">
            <DxChartSeriesLabelBorder Visible="true"
                                      DashStyle="ChartDashStyle.Dot"
                                      Color="white"
                                      Width="2" />
            <DxChartSeriesLabelConnector Visible="true"
                                         Width="3" />
            <DxChartFont Size="14" Weight="600"/>
        </DxChartSeriesLabel>
    </DxChartLineSeries>
    <DxChartLegend Visible="false" />
    <DxChartValueAxis>
        <DxChartAxisTitle Text="Temperature, °F" />
    </DxChartValueAxis>
    <DxChartArgumentAxis>
        <DxChartAxisLabel Format="ChartElementFormat.Month" />
    </DxChartArgumentAxis>
</DxChart>


@code {
    IEnumerable<DetailedWeatherSummary> WeatherForecasts;

    protected override async Task OnInitializedAsync() {
        WeatherForecasts = await WeatherSummaryDataProvider.GetDataAsync();
    }

    protected void PreparePointLabel(ChartSeriesPointCustomizationSettings pointSettings) {
        double value = (double)pointSettings.Point.Value;
        if (value > 50 && value < 70)
            pointSettings.PointLabel.Visible = true;
    }
}
See Also