DxPieChartAnnotation.Location Property
Specifies whether to position the annotation at the edge or in the center of the specified argument.
Namespace: DevExpress.Blazor
Assembly: DevExpress.Blazor.v26.1.dll
Declaration
[DefaultValue(PieChartAnnotationLocation.Center)]
[Parameter]
public PieChartAnnotationLocation Location { get; set; }
Property Value
| Type | Default | Description |
|---|---|---|
| PieChartAnnotationLocation | Center | An enumeration value. |
Available values:
| Name | Description | Image |
|---|---|---|
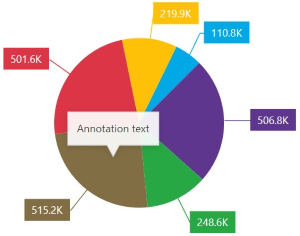
| Center | Positions an annotation at the center of a series slice. |
|
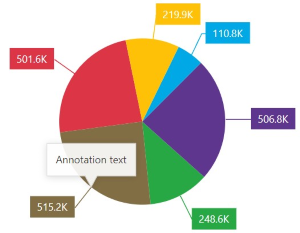
| Edge | Positions an annotation at the edge of a series slice. |
|
Remarks
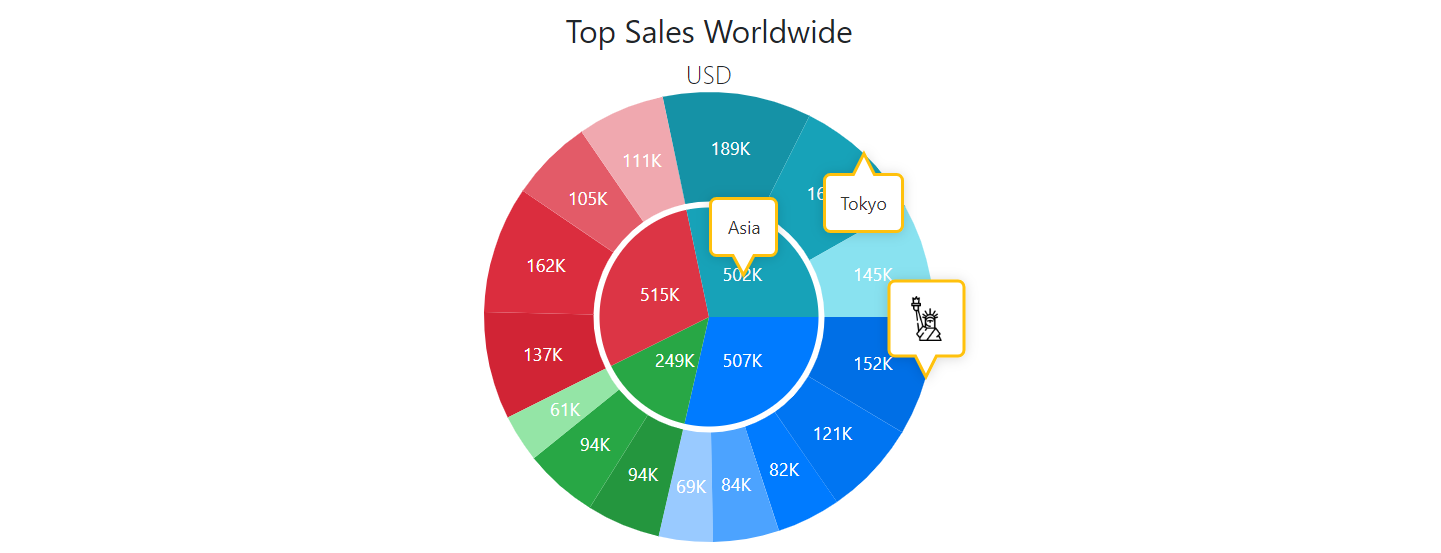
In DxPieChart, you can create anchored annotations that point to series points specified by the Argument property. The Location property allows you to position the annotation at the edge or in the center of the specified argument.
<DxPieChart Data="@SalesData"
            T="SaleInfo">
    <DxPieChartAnnotation Text="Asia"
                          Argument="@("Asia")"
                          Series="Region Sales"
                          Opacity="1">
        <DxChartAnnotationBorder Color="#FFC107" Width="2" CornerRadius="4" />
    </DxPieChartAnnotation>
    <DxPieChartAnnotation Text="Tokyo"
                          Argument="@("Tokyo")"
                          Series="City Sales"
                          Location="PieChartAnnotationLocation.Edge"
                          Opacity="1">
        <DxChartAnnotationBorder Color="#FFC107" Width="2" CornerRadius="4" />
    </DxPieChartAnnotation>
    <DxPieChartAnnotation Type="ChartAnnotationType.Image"
                          Argument="@("New York")"
                          Series="City Sales"
                          Location="PieChartAnnotationLocation.Edge"
                          Opacity="1">
        <DxChartAnnotationImage Url="https://cdn-icons-png.flaticon.com/512/618/618848.png" />
        <DxChartAnnotationBorder Color="#FFC107" Width="2" CornerRadius="4" />
    </DxPieChartAnnotation>
    <DxPieChartSeries T="SaleInfo"
                      TArgument="string"
                      TValue="double"
                      ValueField="si => si.Amount"
                      ArgumentField="si => si.Region"
                      SummaryMethod="Enumerable.Sum"
                      Name="Region Sales">
        @* ... *@
    </DxPieChartSeries>
    <DxPieChartSeries T="SaleInfo"
                      TArgument="string"
                      TValue="double"
                      ValueField="si => si.Amount"
                      ArgumentField="si => si.City"
                      SummaryMethod="Enumerable.Sum"
                      Name="City Sales">
        @* ... *@
    </DxPieChartSeries>
    <DxChartTitle Text="Top Sales Worldwide">
        <DxChartSubTitle Text="USD" />
    </DxChartTitle>
</DxPieChart>
See Also