DxChartAnnotationBase<T>.Argument Property
Specifies a data point’s argument to anchor the annotation.
Namespace: DevExpress.Blazor
Assembly: DevExpress.Blazor.v26.1.dll
Declaration
[Parameter]
public object Argument { get; set; }
Property Value
| Type | Description |
|---|---|
| Object | The data point’s argument. |
Remarks
Specify the Argument property to anchor the annotation to a chart element. You can use one of the following approaches:
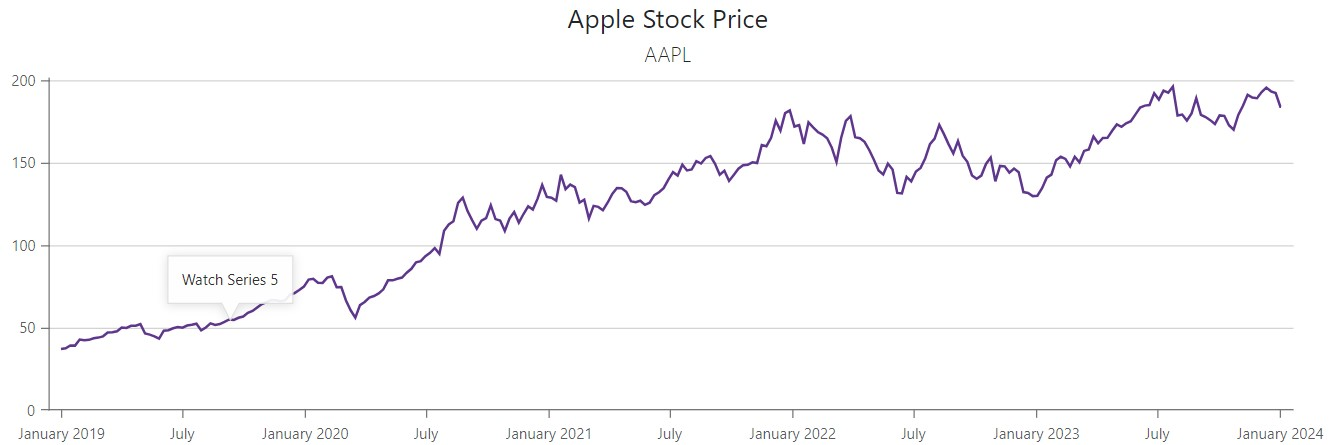
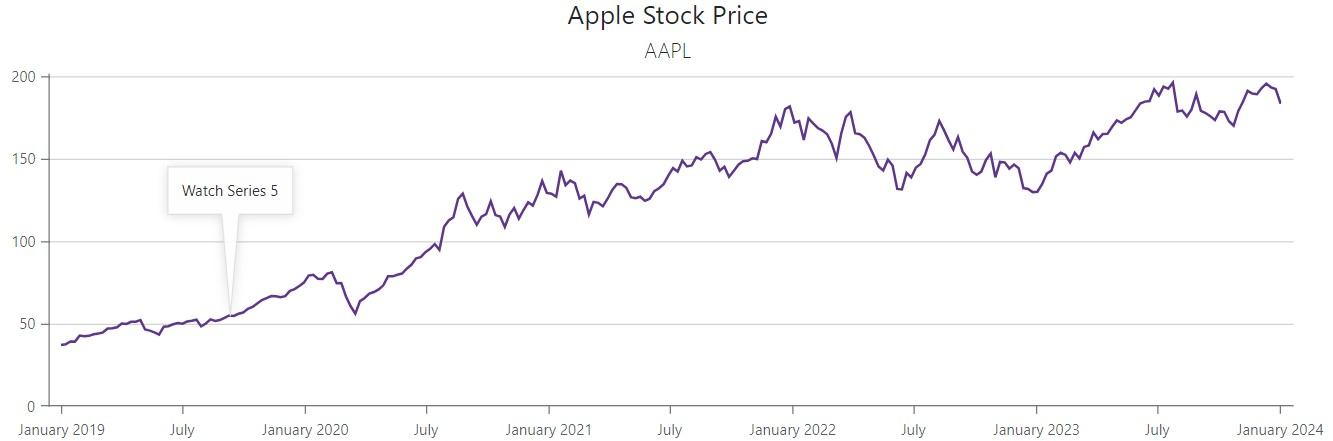
Anchor the Annotation to a Series Point
Use the annotation’s Series and Argument properties to dock the annotation to a particular series point.
<DxChart Data="@DataSource">
    <DxChartLineSeries ValueField="@((ApplePrice i) => i.Close)"
                       ArgumentField="@((ApplePrice i) => i.Date)"
                       Name="AAPL" />
    <DxChartAnnotation Argument="new DateTime(2019, 9, 10)"
                       Series="AAPL"
                       Text="Watch Series 5">
    </DxChartAnnotation>
</DxChart>
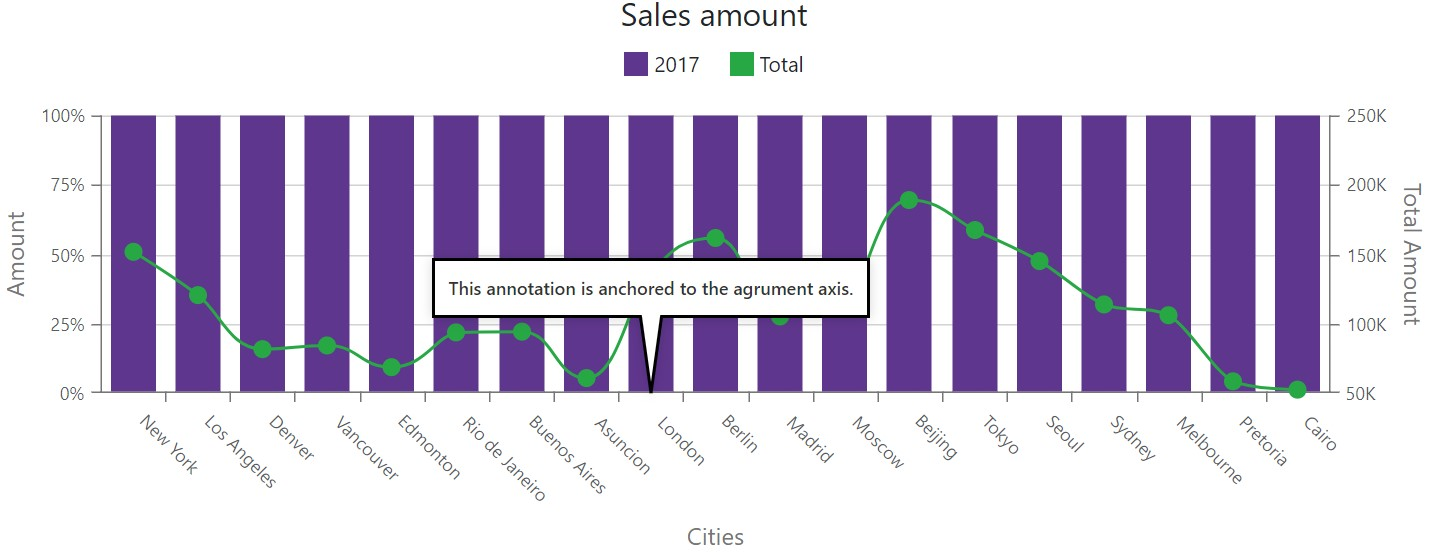
Display the Annotation on an Axis
In DxChart, specify the annotation’s DxChartAnnotationBase.Argument property to anchor the annotation to the argument axis. If your DxChart component contains multiple axes, specify the DxChartAnnotation.Axis property.
<DxChart Data="SalesData">
    @* ... *@
    <DxChartArgumentAxis>
        <DxChartAxisTitle Text="Cities" />
    </DxChartArgumentAxis>
    @* ... *@
    <DxChartAnnotation Argument="@("London")"
                        Text="This annotation is anchored to the agrument axis."
                        Opacity="1"
                        VerticalOffset="-70">
        <DxChartFont Weight="600" />
        <DxChartAnnotationBorder Width="2" Color="black" />
    </DxChartAnnotation>
<DxChartFullStackedBarSeries Name="2017"
                                Filter="@((SaleInfo s) => s.Date.Year == 2017)"
                                SummaryMethod="Enumerable.Sum"
                                ArgumentField="@(s => s.City)"
                                ValueField="@(s => s.Amount)" />
<DxChartSplineSeries Name="Total"
                        SummaryMethod="Enumerable.Sum"
                        ArgumentField="@((SaleInfo s) => s.City)"
                        ValueField="@(s => s.Amount)"
                        Axis="TotalAxis" />
</DxChart>
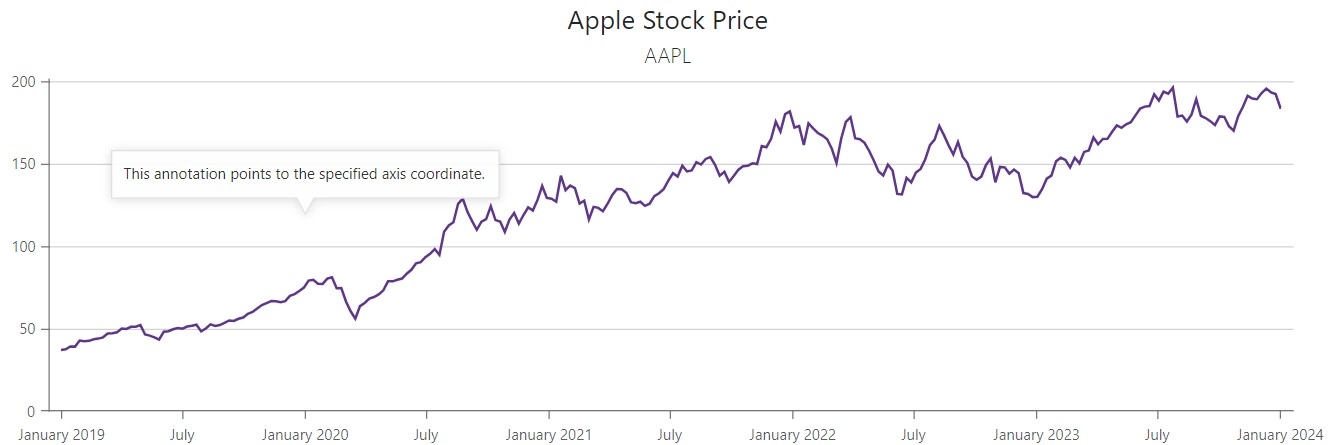
Anchor the Annotation to a Chart Coordinate
In DxChart, specify both Argument and Value properties to anchor the annotation to the specified axis coordinate.
<DxChart Data="@DataSource">
    <DxChartLineSeries ValueField="@((ApplePrice i) => i.Close)"
                       ArgumentField="@((ApplePrice i) => i.Date)"
                       Name="AAPL" />
    <DxChartAnnotation Value="120"
                       Argument="new DateTime(2020, 1, 1)"
                       Text="This annotation points to the specified axis coordinate.">
    </DxChartAnnotation>
</DxChart>
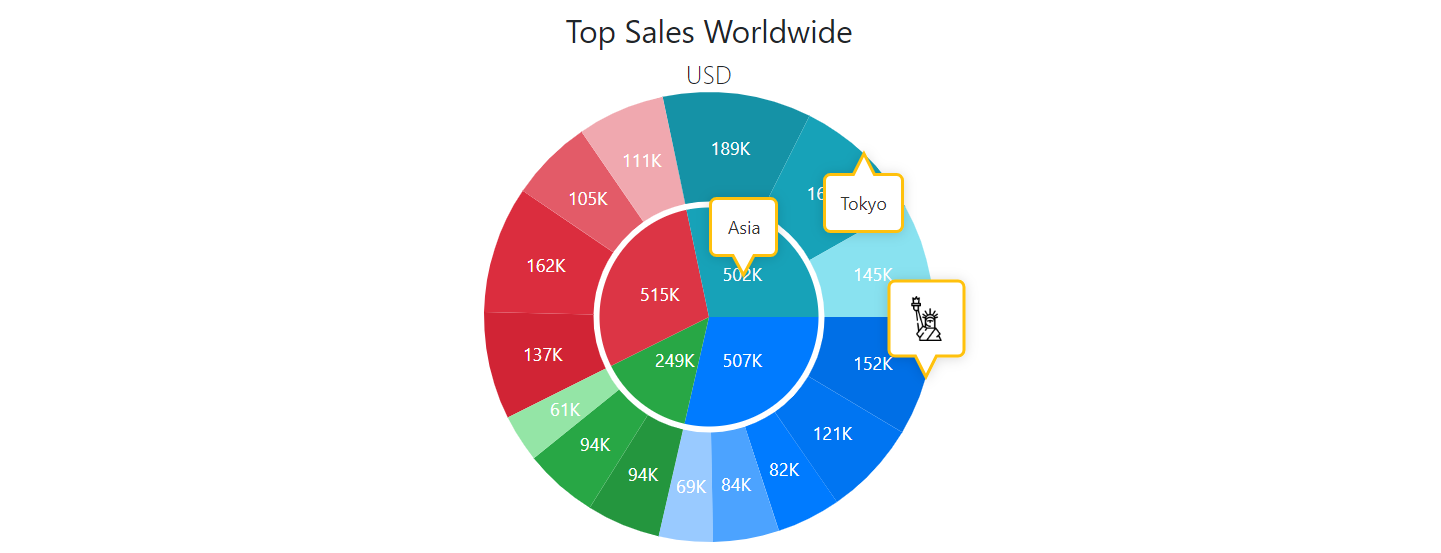
Position the Annotation at an Argument’s Edge
In DxPieChart, use Argument and Location properties to position the annotation at the edge or in the center of the specified argument.
<DxPieChart Data="@SalesData">
    @* ... *@
    <DxPieChartAnnotation Text="Tokyo"
                            Argument="@("Tokyo")"
                            Series="City Sales"
                            Location="PieChartAnnotationLocation.Edge"
                            Opacity="1">
        <DxChartAnnotationBorder Color="#FFC107" Width="2" CornerRadius="4" />
    </DxPieChartAnnotation>
    <DxPieChartAnnotation Type="ChartAnnotationType.Image"
                            Argument="@("New York")"
                            Series="City Sales"
                            Location="PieChartAnnotationLocation.Edge"
                            Opacity="1">
        <DxChartAnnotationImage Url="https://cdn-icons-png.flaticon.com/512/618/618848.png" />
        <DxChartAnnotationBorder Color="#FFC107" Width="2" CornerRadius="4" />
    </DxPieChartAnnotation>
    @* ... *@
</DxPieChart>
Mixed Anchoring
You can use pixel and chart coordinates simultaneously to place the anchored annotation to the specified position.
<DxChart Data="@DataSource">
    <DxChartLineSeries ValueField="@((ApplePrice i) => i.Close)"
                        ArgumentField="@((ApplePrice i) => i.Date)"
                        Name="AAPL" />
    <DxChartAnnotation Argument="new DateTime(2019, 9, 10)"
                        Series="AAPL"
                        PositionX="175"
                        PositionY="100"
                        Text="Watch Series 5">
    </DxChartAnnotation>
</DxChart>
Refer to the following section for additional information about annotations: Annotations in Blazor Charts.