DxChartXYSeries<T, TArgument, TValue, TAggregate>.SummaryMethod Property
Specifies the method that calculates summaries for points with the same argument value.
Namespace: DevExpress.Blazor
Assembly: DevExpress.Blazor.v26.1.dll
Declaration
[Parameter]
public Func<IEnumerable<TAggregate>, TAggregate> SummaryMethod { get; set; }
Property Value
| Type | Description |
|---|---|
| Func<IEnumerable<TAggregate>, TAggregate> | A method defined by the Func<IEnumerable<T>, T> signature. For example, Sum(IEnumerable<Int32>) |
Remarks
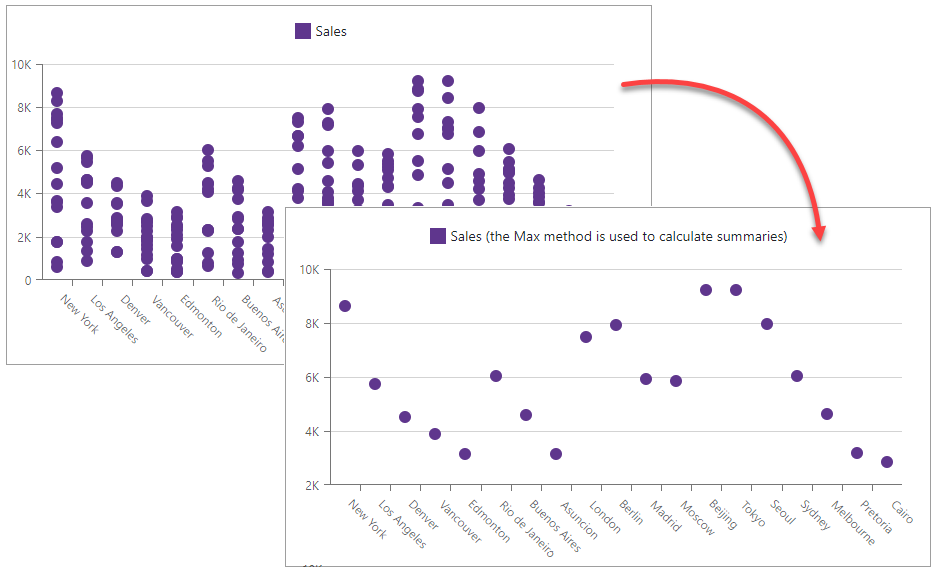
The Chart component can use a summary method to group data. This method calculates summaries for points with the same argument value, and the chart shows the resulting values as series points. This feature allows you to decrease the number of visible points and to optimize chart performance.
Note that the chart calculates summaries when it loads data and does not re-calculate them when users zoom the chart.
Use the DxChartSeries.SummaryMethod property to specify an individual summary method for each series. To specify summary method for all chart series, use the DxChartCommonSeries.SummaryMethod property.
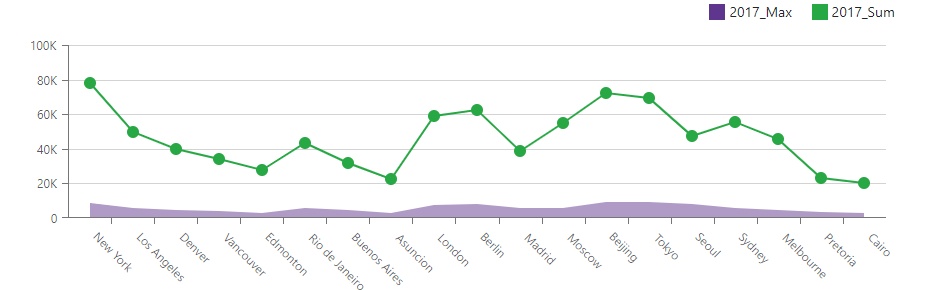
@using Chart.Data

<DxChart Data="@SalesData">
    <DxChartAreaSeries Name="2017_Max"
                        Filter="@((SaleInfo s) => s.Date.Year == 2017)"
                        ArgumentField="@(s => s.City)"
                        ValueField="@(s => s.Amount)"
                        SummaryMethod="Enumerable.Max" />
    <DxChartLineSeries Name="2017_Sum"
                        Filter="@((SaleInfo s) => s.Date.Year == 2017)"
                        ArgumentField="@(s => s.City)"
                        ValueField="@(s => s.Amount)"
                        SummaryMethod="Enumerable.Sum" />
    <DxChartLegend Position="RelativePosition.Outside" HorizontalAlignment="HorizontalAlignment.Right" />
</DxChart>

@code {
    IEnumerable<SaleInfo> SalesData;

    protected override async Task OnInitializedAsync() {
        SalesData = await Sales.GetSalesAsync();
    }
}
Summaries vs Aggregation
You can also use aggregation methods to decrease the number of visible points and optimize the chart performance.
The table below describes the difference between aggregation and summaries.
| Aggregation | Summaries | |
|---|---|---|
| Points to Group | The chart aggregates points with different argument values (on a specific interval of X-axis). | The chart calculates summaries for points with the same argument value. |
| Behavior on Zoom | The chart aggregates data when it loads them and re-aggregates data when users zoom the chart. | The chart calculates summaries only when it loads data. |