DxChartXYSeries<T, TArgument, TValue, TAggregate>.ValueField Property
Specifies a data source field that contains values for series points.
Namespace: DevExpress.Blazor
Assembly: DevExpress.Blazor.v26.1.dll
Declaration
[Parameter]
public Expression<Func<T, TValue>> ValueField { get; set; }
Property Value
| Type | Description |
|---|---|
| Expression<Func<T, TValue>> | The field name. |
Remarks
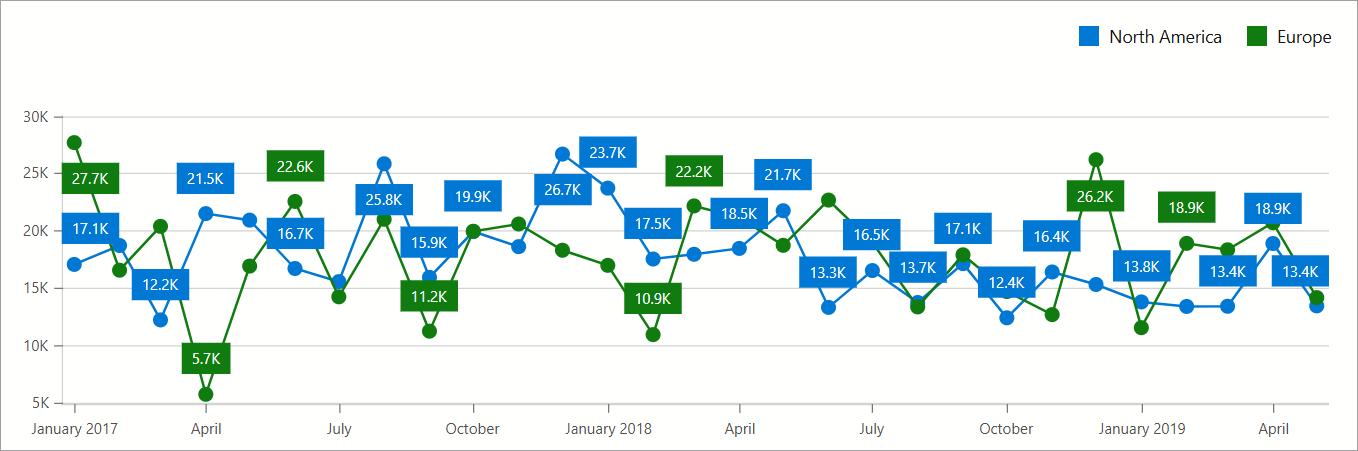
Use the Data property to bind the Chart to an IEnumerable<T> data source. Set the ArgumentField and ValueField properties to data source fields that contain arguments and values for chart points.
<DxChart Data="chartsData"
         Width="100%"
         LabelOverlap="ChartLabelOverlap.Hide">
    <DxChartLineSeries Name="North America"
                       ArgumentField="si => new DateTime(si.Date.Year, si.Date.Month, 1)"
                       ValueField="si => si.Amount"
                       Filter='si => si.Region == "North America" '
                       HoverMode="ChartContinuousSeriesHoverMode.None">
    </DxChartLineSeries>
    <DxChartLineSeries Name="Europe"
                       ArgumentField="si => new DateTime(si.Date.Year, si.Date.Month, 1)"
                       ValueField="si => si.Amount"
                       Filter='si => si.Region == "Europe"'
                       HoverMode="ChartContinuousSeriesHoverMode.None">
    </DxChartLineSeries>
    <DxChartLegend Position="RelativePosition.Outside"
                   HorizontalAlignment="HorizontalAlignment.Right" />
</DxChart>
If you set the ArgumentField or ValueField property to a DateTime data field that contains a time part, the SummaryMethod property may not be applicable. To avoid this situation, extract the day part only as shown in the following code snippet:
<DxChart Data="@WeatherForecasts">
    <DxChartBarSeries Name="Max Temperature, C"
                      SummaryMethod="@((v) => (int)Enumerable.Max(v))"
                      ArgumentField="@(s => s.Date.Date)"
                      ValueField="@((WeatherForecast s) => s.TemperatureC)"/>
</DxChart>
See Also