DxChartAxisBase<T>.DiscreteDivisionMode Property
Specifies whether ticks and grid lines lie between or next to axis labels.
Namespace: DevExpress.Blazor
Assembly: DevExpress.Blazor.v26.1.dll
Declaration
[DefaultValue(ChartDiscreteAxisDivisionMode.BetweenLabels)]
[Parameter]
public ChartDiscreteAxisDivisionMode DiscreteDivisionMode { get; set; }
Property Value
| Type | Default | Description |
|---|---|---|
| ChartDiscreteAxisDivisionMode | BetweenLabels | An enumeration value. |
Available values:
| Name | Description |
|---|---|
| BetweenLabels | Axis labels are situated between major ticks and grid lines. |
| CrossLabels | Displays axis labels next to major ticks and grid lines. |
Remarks
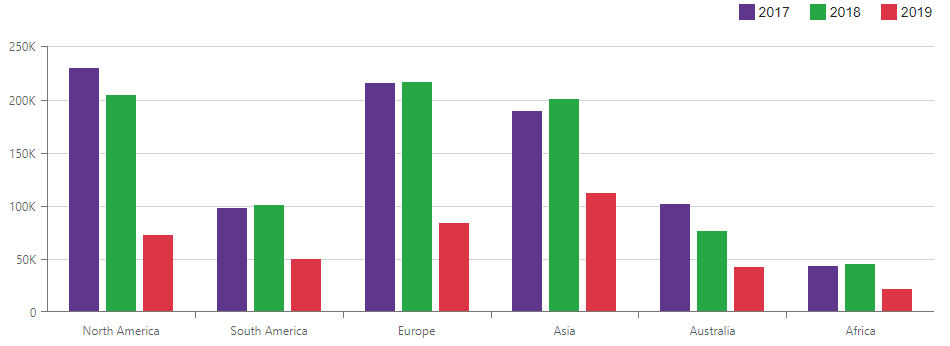
The Chart’s default axes of the Discrete type display labels between two neighboring ticks and grid lines as shown in the image below. This behavior corresponds to the BetweenLabels mode:
The following code snippet places grid lines and ticks next to axis labels (DiscreteDivisionMode="ChartDiscreteAxisDivisionMode.CrossLabels"):
<DxChart Data="@dataSource">
    <DxChartBarSeries Name="2017"
                      Filter="@((SaleInfo s) => s.Date.Year == 2017)"
                      ArgumentField="@(s => s.Region)"
                      ValueField="@(s => s.Amount)"
                      SummaryMethod="Enumerable.Sum" />
    <DxChartBarSeries Name="2018"
                      Filter="@((SaleInfo s) => s.Date.Year == 2018)"
                      ArgumentField="@(s => s.Region)"
                      ValueField="@(s => s.Amount)"
                      SummaryMethod="Enumerable.Sum" />
    <DxChartBarSeries Name="2019"
                      Filter="@((SaleInfo s) => s.Date.Year == 2019)"
                      ArgumentField="@(s => s.Region)"
                      ValueField="@(s => s.Amount)"
                      SummaryMethod="Enumerable.Sum" />
    <DxChartArgumentAxis Type="ChartAxisType.Discrete"
                         DiscreteDivisionMode="ChartDiscreteAxisDivisionMode.CrossLabels" />
    <DxChartLegend Position="RelativePosition.Outside" HorizontalAlignment="HorizontalAlignment.Right" />
</DxChart>

See Also