DxChartAggregationSettings.Enabled Property
Enables data aggregation.
Namespace: DevExpress.Blazor
Assembly: DevExpress.Blazor.v26.1.dll
Declaration
[Parameter]
public bool Enabled { get; set; }
Property Value
| Type | Description |
|---|---|
| Boolean |
|
Remarks
Use the Enabled property to enable data aggregation.
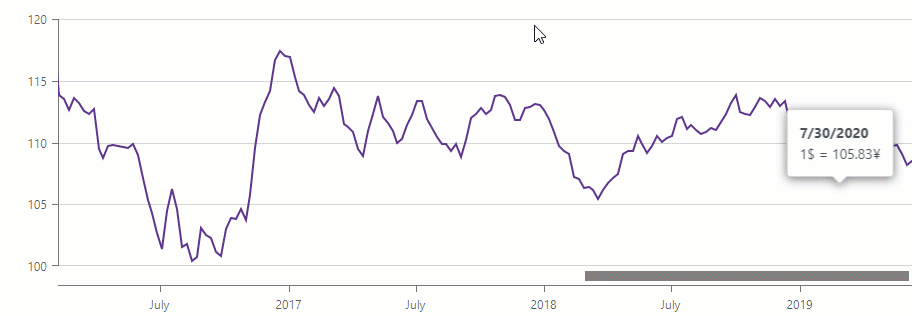
<DxChart T="BargainDataPoint"
            Data="@UsdJpyData"
            @key="@Params.ThemeName"
            CssClass="chart-container">
    <DxChartLegend Position="RelativePosition.Inside"
                    VerticalAlignment="VerticalEdge.Top"
                    HorizontalAlignment="HorizontalAlignment.Right" />
    <DxChartLineSeries T="BargainDataPoint"
                        TArgument="DateTime"
                        TValue="double"
                        ArgumentField="i => i.DateTimeStamp"
                        ValueField="i => i.Price"
                        Name="USDJPY">
        <DxChartSeriesPoint Visible="false" />
        <DxChartAggregationSettings Enabled="true"
                                    Method="ChartAggregationMethod.Average" />
    </DxChartLineSeries>
    <DxChartArgumentAxis>
        <DxChartAxisRange StartValue="new DateTime(2020, 01, 01)"
                            EndValue="new DateTime(2021, 01, 29)" />
    </DxChartArgumentAxis>
    <DxChartZoomAndPanSettings ArgumentAxisZoomAndPanMode="ChartAxisZoomAndPanMode.Both" />
    <DxChartScrollBarSettings ArgumentAxisScrollBarVisible="true"
                                ArgumentAxisScrollBarPosition="ChartScrollBarPosition.Bottom" />
    <DxChartTooltip Enabled="true" Position="RelativePosition.Outside">
        <div class="tooltip-content">
            <div class="tooltip-title">@(((DateTime)context.Point.Argument).ToString("d"))</div>
            <div>1$ = @(context.Point.Value)¥</div>
        </div>
    </DxChartTooltip>
</DxChart>

@code {
    IEnumerable<BargainDataPoint> UsdJpyData;
    @inject ICurrencyExchangeDataProvider UsdJpyDataProvider

    protected override async Task OnInitializedAsync() {
        UsdJpyData = await UsdJpyDataProvider.GetDataAsync();
    }
}
See Also