DxChartAxisLabel.RotationAngle Property
Specifies the rotation angle of axis labels when the Overlap or DisplayMode property is set to Rotate.
Namespace: DevExpress.Blazor
Assembly: DevExpress.Blazor.v26.1.dll
Declaration
[DefaultValue(45)]
[Parameter]
public double RotationAngle { get; set; }
Property Value
| Type | Default | Description |
|---|---|---|
| Double | 45 | The rotation angle in degrees. |
Remarks
The RotationAngle property allows you to specify the rotation angle of axis labels. To enable label rotation, set the Overlap or DisplayMode property to Rotate. Note that the value Rotate applies to horizontal axes only.
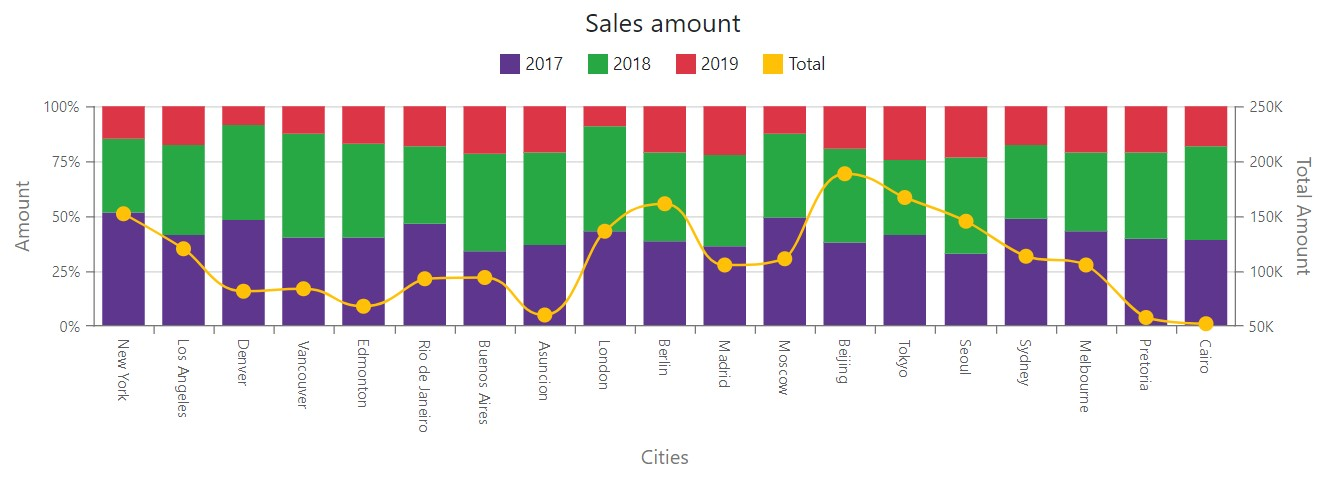
The following example rotates labels of the horizontal axis at the specified angle:
<DxChart Data="SalesData">
    <DxChartTitle Text="Sales amount" />
    <DxChartLegend Position="RelativePosition.Outside" />
    <DxChartArgumentAxis>
        <DxChartAxisTitle Text="Cities" />
        <DxChartAxisLabel Overlap="ChartAxisLabelOverlap.Rotate"
                          RotationAngle="90" />
    </DxChartArgumentAxis>
    @* ... *@
    <DxChartFullStackedBarSeries Name="2017"
                                 Filter="@((SaleInfo s) => s.Date.Year == 2017)"
                                 SummaryMethod="Enumerable.Sum"
                                 ArgumentField="@(s => s.City)"
                                 ValueField="@(s => s.Amount)" />
    <DxChartFullStackedBarSeries Name="2018"
                                 Filter="@((SaleInfo s) => s.Date.Year == 2018)"
                                 SummaryMethod="Enumerable.Sum"
                                 ArgumentField="@(s => s.City)"
                                 ValueField="@(s => s.Amount)" />
    <DxChartFullStackedBarSeries Name="2019"
                                 Filter="@((SaleInfo s) => s.Date.Year == 2019)"
                                 SummaryMethod="Enumerable.Sum"
                                 ArgumentField="@(s => s.City)"
                                 ValueField="@(s => s.Amount)" />
    <DxChartSplineSeries Name="Total"
                         SummaryMethod="Enumerable.Sum"
                         ArgumentField="@((SaleInfo s) => s.City)"
                         ValueField="@(s => s.Amount)"
                         Axis="TotalAxis" />
</DxChart>
See Also