DxPolarChartLineSeries<T, TArgument, TValue>.HoverMode Property
Specifies highlighted series elements when a user hovers the mouse pointer over the series.
Namespace: DevExpress.Blazor
Assembly: DevExpress.Blazor.v25.2.dll
NuGet Package: DevExpress.Blazor
Declaration
[DefaultValue(ChartContinuousSeriesHoverMode.Series)]
[Parameter]
public ChartContinuousSeriesHoverMode HoverMode { get; set; }
Property Value
| Type | Default | Description |
|---|---|---|
| ChartContinuousSeriesHoverMode | Series | An enumertion value. |
Available values:
| Name | Description | Image |
|---|---|---|
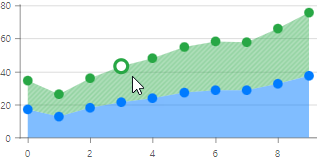
| NearestPoint | The series changes its style along with the point that is the nearest to the cursor. |
|
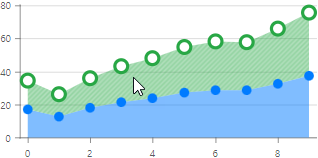
| SeriesAndAllPoints | The series changes its style along with all the points. |
|
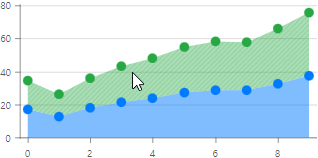
| Series | The series changes its style, but the points do not. |
|
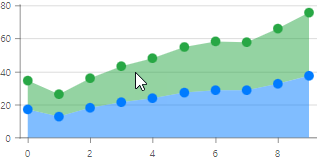
| None | The series does not react to hovering. |
|
Remarks
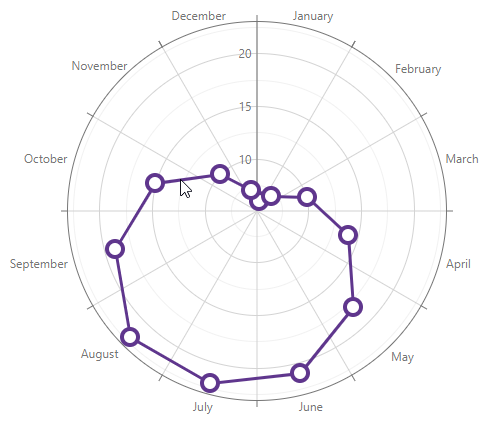
The Polar Chart highlights series elements when the mouse pointer is above the series. Use the HoverMode property to specify highlighted series elements.
The following example highlights a series and all its points when a user hovers the mouse pointer over the series:
<DxPolarChart Data=@DataSource>
    <DxPolarChartLineSeries ArgumentField="@((DiscretePoint i) => i.Arg)"
                            ValueField="@((DiscretePoint i) => i.Day)"
                            HoverMode="ChartContinuousSeriesHoverMode.SeriesAndAllPoints">
    </DxPolarChartLineSeries>
</DxPolarChart>
