DxPivotGrid<T> Class
An Excel-inspired pivot table component engineered for multi-dimensional data analysis and cross-tab reporting.
Namespace: DevExpress.Blazor
Assembly: DevExpress.Blazor.v23.2.dll
NuGet Package: DevExpress.Blazor
Declaration
public class DxPivotGrid<T> :
    DxPivotGrid
Type Parameters
| Name | Description |
|---|---|
| T | The data item type. |
Remarks
The DevExpress Pivot Grid for Blazor (<DxPivotGrid>) allows you to display and analyze multi-dimensional data from the underlying data source. Use this component to calculate summaries and totals against individual values and display the results within the pivot table’s cells.
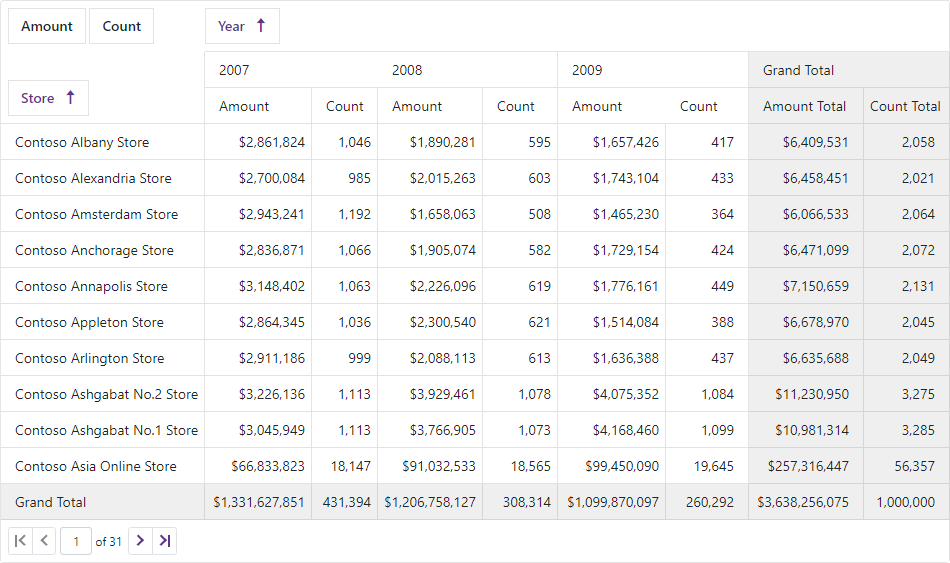
Add a Pivot Grid to a Project
Follow the steps below to add the Pivot Grid component to an application:
- Use a DevExpress Project Template to create a new Blazor Server or Blazor WebAssembly application. If you use a Microsoft project template or already have a Blazor project, configure your project to incorporate DevExpress Blazor components.
- Add the
<DxPivotGrid>…</DxPivotGrid>markup to a.razorfile. - Bind the Pivot Grid to a strongly-typed data collection.
- Specify fields that supply data to columns, rows, and data cells.
- Specify other Pivot Grid options (see the sections below).
Bind to Data
Use the Data property to bind <DxPivotGrid> to a strongly-typed collection.
Note
The Pivot Grid operates in bound mode only. Unbound mode is not supported.
@if(GridData == null) {
    <p><em>Loading...</em></p>
} else {
    <DxPivotGrid Data="@GridData">
        <DxPivotGridField Field="@nameof(SaleInfo.Region)" SortOrder="PivotGridSortOrder.Ascending" Area="PivotGridFieldArea.Row"></DxPivotGridField>
        <DxPivotGridField Field="@nameof(SaleInfo.Country)" Area="PivotGridFieldArea.Row"></DxPivotGridField>
        <DxPivotGridField Field="@nameof(SaleInfo.City)" Area="PivotGridFieldArea.Row"></DxPivotGridField>
        <DxPivotGridField Field="@nameof(SaleInfo.Date)" GroupInterval="PivotGridGroupInterval.Year" Area="PivotGridFieldArea.Column" Caption="Year"></DxPivotGridField>
        <DxPivotGridField Field="@nameof(SaleInfo.Date)" GroupInterval="PivotGridGroupInterval.Quarter" Area="PivotGridFieldArea.Column" Caption="Quarter">
            <HeaderTemplate>@string.Format("Q{0}", context)</HeaderTemplate>
        </DxPivotGridField>
        <DxPivotGridField Field="@nameof(SaleInfo.Amount)" Area="PivotGridFieldArea.Data" SummaryType="PivotGridSummaryType.Sum"></DxPivotGridField>
        <DxPivotGridField Field="@nameof(SaleInfo.OrderId)" Caption="Count" Area="PivotGridFieldArea.Data" SummaryType="PivotGridSummaryType.Count"></DxPivotGridField>
    </DxPivotGrid>
}
@code {
    IQueryable<SaleInfo> GridData;

    protected override async Task OnInitializedAsync() {
        GridData = await Sales.Load();
    }
}
Fields
The Pivot Grid fields supply data to <DxPivotGrid> columns, rows, and data cells. The DxPivotGridField class defines a field.
<DxPivotGrid Data="@GridData">
    <DxPivotGridField Field="@nameof(SaleInfo.Date)" Area="PivotGridFieldArea.Column"></DxPivotGridField>
    ...
</DxPivotGrid>
Use the field’s Area property to specify the field location: Column Header Area, Row Header Area, or Data Header Area.
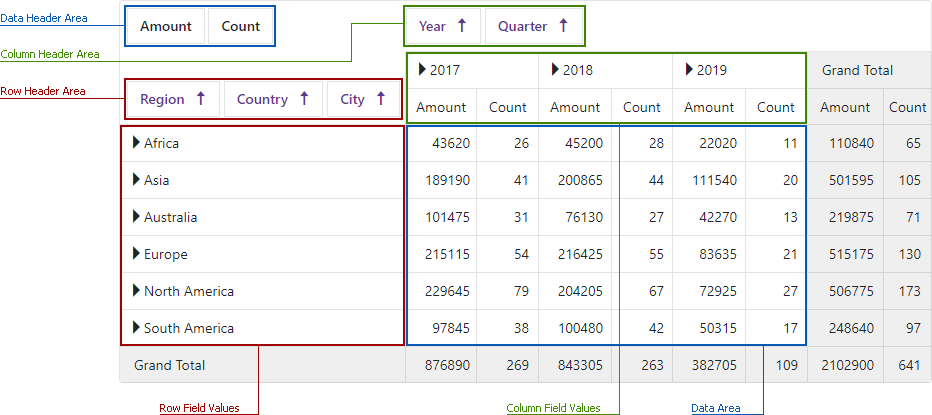
Column Header Area contains fields that define grid columns.
<DxPivotGridField Field="@nameof(SaleInfo.Date)"
                  Area="PivotGridFieldArea.Column" />
Row Header Area contains fields that define grid rows.
<DxPivotGridField Field="@nameof(SaleInfo.Region)"
                  Area="PivotGridFieldArea.Row" />
Data Header Area contain fields that store data for grid cells.
<DxPivotGridField Field="@nameof(SaleInfo.OrderId)"
                  Area="PivotGridFieldArea.Data"
                  Caption="Count"
                  SummaryType="PivotGridSummaryType.Count" />
Note
To hide field headers, set the ShowFieldHeaders property to false.
Cells
Pivot Grid cells display summaries calculated against data fields. The SummaryType property specifies the field’s summary type.
<DxPivotGridField Field="@nameof(SaleInfo.OrderId)"
                  Area="PivotGridFieldArea.Data"
                  Caption="Count"
                  SummaryType="PivotGridSummaryType.Count" />
The available summary types are:
| Summary Type | Description |
|---|---|
| Sum (the default type) |
The sum of the field values. This type applies to numeric fields only.  |
| Avg | The average of the field values. This type applies to numeric fields only.  |
| Count | The total number of field values. |
| Max | The largest field value. |
| Min | The smallest field value. |
Totals
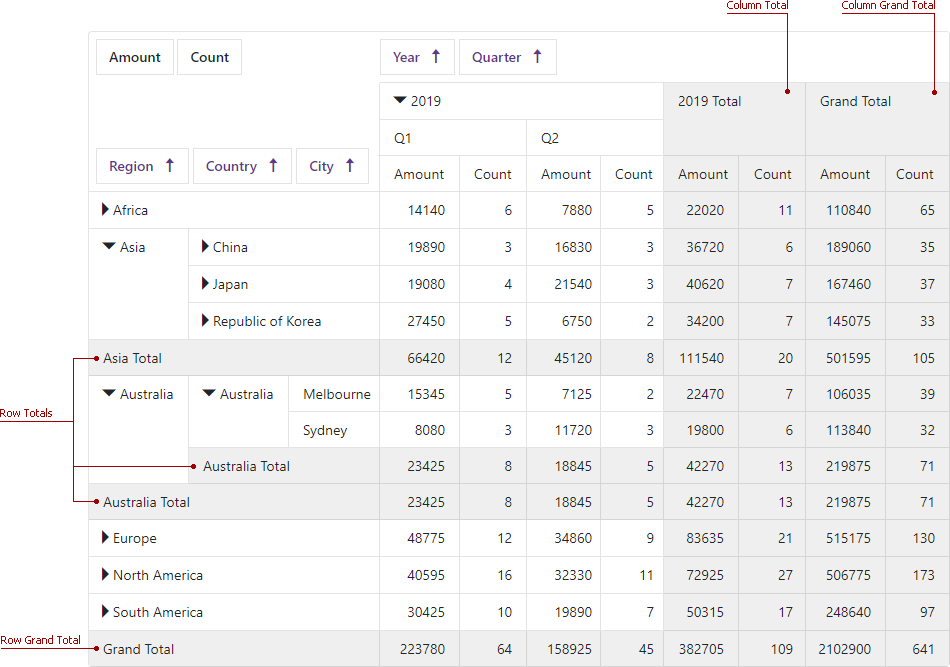
DxPivotGrid calculates totals and displays them as separate columns and rows. Totals use the corresponding data field’s summary type for calculations.
The Pivot Grid component supports the following totals:
- Row/column totals display sub-totals calculated for outer row/column fields.
- Row/column grand totals display summary totals calculated against all the rows/columns. To hide grand totals, set the ShowGrandTotals property to false.
Sort Data
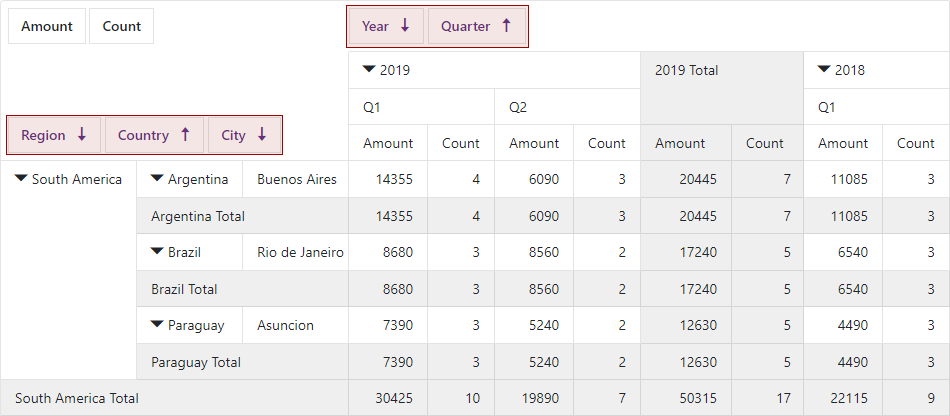
DxPivotGrid data is always sorted by row and column fields. A field header displays a sort order (ascending or descending) for the corresponding field’s values. To change the sort order, use the SortOrder property in code or click the field header at runtime.
<DxPivotGridField Field="@nameof(SaleInfo.Region)" SortOrder="SortOrder.Ascending"></DxPivotGridField>
Group Data
You can group grid data by date/time field values. To specify how field values are grouped, use the GroupInterval property.
<DxPivotGrid Data="@GridData">
    <DxPivotGridField Field="@nameof(SaleInfo.Date)"
                      Area="PivotGridFieldArea.Column"
                      GroupInterval="PivotGridGroupInterval.Year"
                      Caption="Year">
    </DxPivotGridField>
    <DxPivotGridField Field="@nameof(SaleInfo.Date)"
                      Area="PivotGridFieldArea.Column"
                      GroupInterval="PivotGridGroupInterval.Quarter"
                      Caption="Quarter">
        <HeaderTemplate>@string.Format("Q{0}", context)</HeaderTemplate>
    </DxPivotGridField>
</DxPivotGrid>
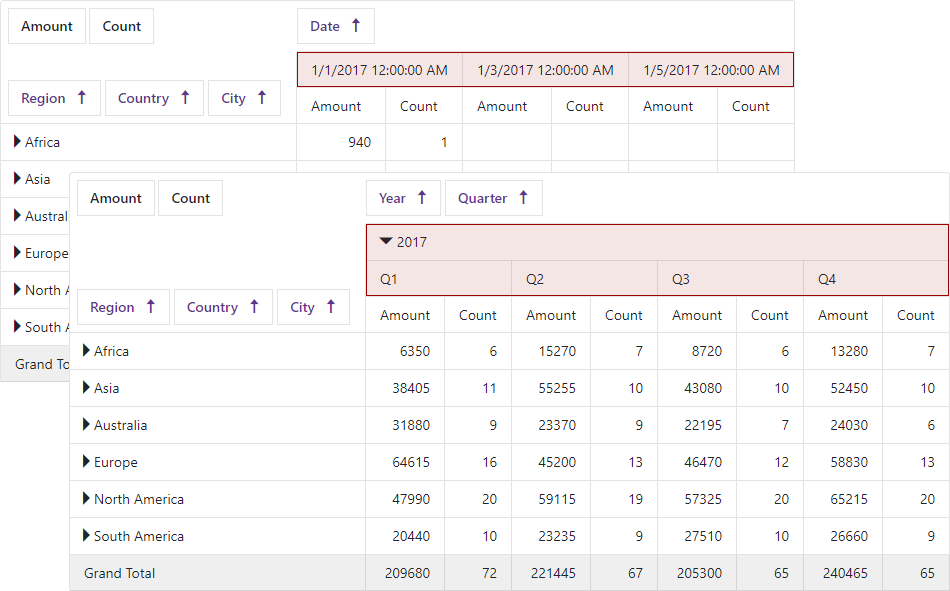
The image below displays DxPivotGrid in two states:
- The
Datefield contains original data. - The
Datefield is grouped by years and quarters.
Visualize Data
Do the following to link <DxPivotGrid> with the DxChart<T> component:
- Create a method that asynchronously loads data from an IEnumerable<T> data source (Sales.Load() in this example).
- Create a DxPivotGridDataProvider<T> object based on the created method.
- Bind the Chart to the provider object. Use the ChartDataSource property.
- Bind the Pivot Grid to the provider object. Use the PivotGridDataSource property.
<DxChart Data="@(PivotGridDataProvider.ChartDataSource)">
    <DxChartCommonSeries NameField="@((IChartDataItem s) => s.SeriesName)"
                         ArgumentField="@(s => s.Argument)"
                         ValueField="@(s => s.Value)"
                         SeriesType="ChartSeriesType.Bar" />
</DxChart>

<DxPivotGrid Data="@(PivotGridDataProvider.PivotGridDataSource)">
    <DxPivotGridField Field="@nameof(SaleInfo.Region)" SortOrder="PivotGridSortOrder.Ascending"
        Area="PivotGridFieldArea.Row"></DxPivotGridField>
    <DxPivotGridField Field="@nameof(SaleInfo.Country)" Area="PivotGridFieldArea.Row"></DxPivotGridField>
    <DxPivotGridField Field="@nameof(SaleInfo.City)" Area="PivotGridFieldArea.Row"></DxPivotGridField>
    <DxPivotGridField Field="@nameof(SaleInfo.Date)" GroupInterval="PivotGridGroupInterval.Year"
        Area="PivotGridFieldArea.Column" Caption="Year"> </DxPivotGridField>
    <DxPivotGridField Field="@nameof(SaleInfo.OrderId)" Caption="Count" Area="PivotGridFieldArea.Data"
        SummaryType="PivotGridSummaryType.Count"> </DxPivotGridField>
</DxPivotGrid>

@code {
    DxPivotGridDataProvider<SaleInfo> PivotGridDataProvider = DxPivotGridDataProvider<SaleInfo>.Create(Sales.Load());
}
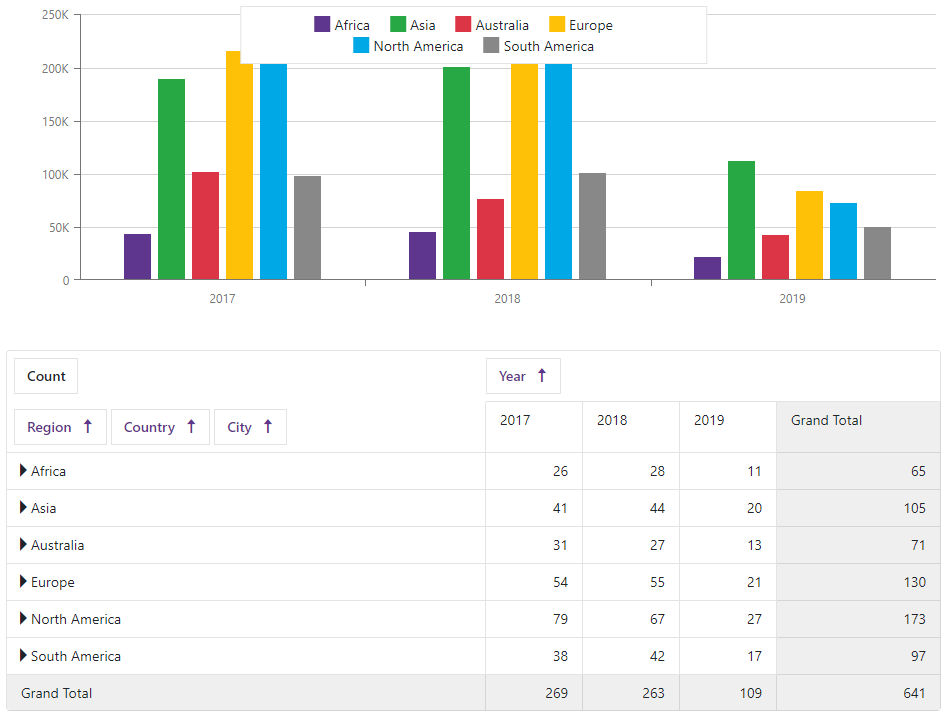
The Chart shows data from the Pivot Grid’s lowest expanded level. The Chart is updated when a user expands or collapses rows/columns in the Pivot Grid.
Paging
Use the PageSize property to specify the maximum number of rows a page can display.
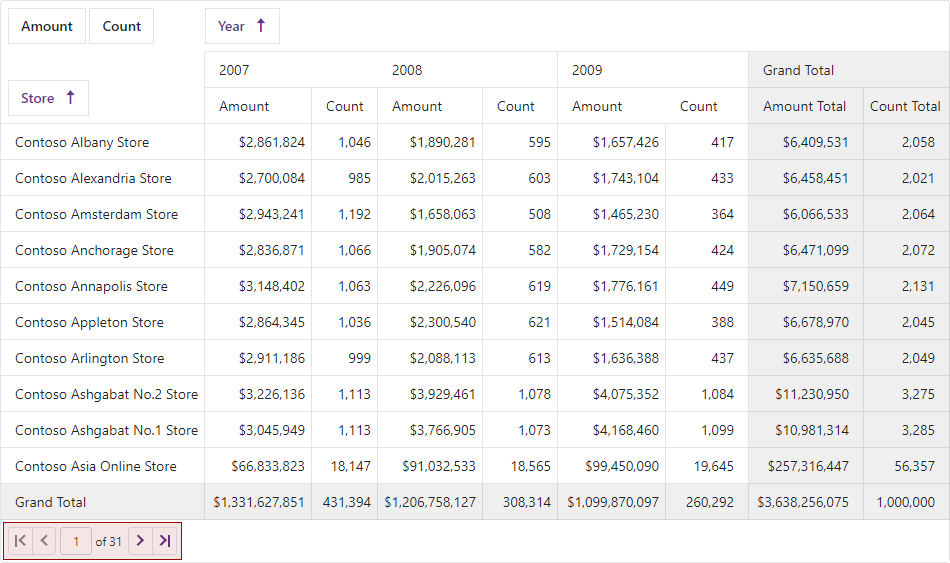
To hide the pager, set the ShowPager property to false.
Templates
To define a completely different look and feel of row/column field headers and data cells, use templates: HeaderTemplate and DataTemplate.
<DxPivotGrid Data="@GridData" ShowGrandTotals="@ShowGrandTotals" ShowFieldHeaders="@ShowFieldHeaders">
    <DxPivotGridField Field="@nameof(SaleInfo.Date)" GroupInterval="PivotGridGroupInterval.Month" Area="PivotGridFieldArea.Column" Caption="Month">
        <HeaderTemplate>
            @System.Globalization.CultureInfo.CurrentCulture.DateTimeFormat.GetMonthName((int)context)
        </HeaderTemplate>
    </DxPivotGridField>
    <DxPivotGridField Field="@nameof(SaleInfo.Amount)" Area="PivotGridFieldArea.Data" SummaryType="PivotGridSummaryType.Sum">

        <DataTemplate>
            <span class="@((decimal)context > 100000 ? "text-success" : "text-danger")">
                @string.Format("{0:c0}", context)
            </span>
        </DataTemplate>
    </DxPivotGridField>
</DxPivotGrid>
Troubleshooting
If a Blazor application throws unexpected exceptions, refer to the following help topic: Troubleshooting.