DxChartBase.ExportAsync(String, ChartExportFormat, Nullable<Int32>, Nullable<Color>) Method
Exports chart data to a file in the specified format.
Namespace: DevExpress.Blazor
Assembly: DevExpress.Blazor.v26.1.dll
Declaration
public Task ExportAsync(
    string fileName,
    ChartExportFormat format,
    int? margin = null,
    Color? backgroundColor = null
)
Parameters
| Name | Type | Description |
|---|---|---|
| fileName | String | The name of exported file. |
| format | ChartExportFormat | The format of the exported file. |
Optional Parameters
| Name | Type | Default | Description |
|---|---|---|---|
| margin | Nullable<Int32> | null | The margin in pixels. |
| backgroundColor | Nullable<Color> | null | The background color in the exported file. |
Returns
| Type | Description |
|---|---|
| Task | A structure that stores an awaitable result of an asynchronous operation. |
Remarks
Warning
DxChart, DxPolarChart, and DxPieChart components can export data in different formats only if the browser supports these formats. Otherwise, charts export data to PNG regardless of which option you select in the menu.
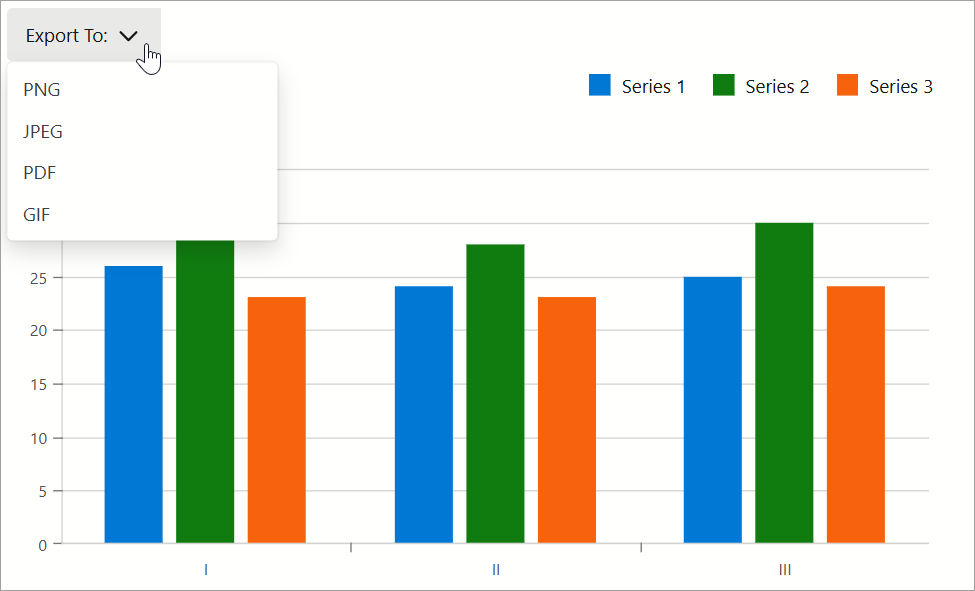
The following code snippet uses a drop-down menu to export chart data to a file in the specified format:
@using System.Drawing
<DxMenu ItemClick="Export">
    <Items>
        <DxMenuItem Text="Export To:">
            <Items>
                <DxMenuItem Text="PNG" />
                <DxMenuItem Text="JPEG" />
                <DxMenuItem Text="PDF" />
                <DxMenuItem Text="GIF" />
            </Items>
        </DxMenuItem>
    </Items>
</DxMenu>
<DxChart @ref="chart"
         Data="@dataPoints"
         LabelOverlap="ChartLabelOverlap.Hide"
         Width=700 Height=400>
    <DxChartBarSeries ArgumentField="@((DataPoint i) => i.Arg)"
                      ValueField="@((DataPoint i) => i.Value1)"
                      Name="Series 1" />
    <DxChartBarSeries ArgumentField="@((DataPoint i) => i.Arg)"
                      ValueField="@((DataPoint i) => i.Value2)"
                      Name="Series 2" />
    <DxChartBarSeries ArgumentField="@((DataPoint i) => i.Arg)"
                      ValueField="@((DataPoint i) => i.Value3)"
                      Name="Series 3" />
    <DxChartLegend Orientation="Orientation.Horizontal"
                   HorizontalAlignment="HorizontalAlignment.Right"
                   Position="RelativePosition.Outside" />
</DxChart>

@code {
    DxChartBase chart;
    private DataPoint[] dataPoints;
    protected override void OnInitialized() {
        dataPoints = GetDataPoints();
    }
    void Export(MenuItemClickEventArgs args) {
        ChartExportFormat format = ChartExportFormat.Png;
        Color backgroundColor = Color.White;
        int margin = 4;
        if(Enum.TryParse<ChartExportFormat>(args.ItemInfo.Text, true, out format))
            chart?.ExportAsync("Exported_Chart", format, margin, backgroundColor);
    }
}
See Also