DxChartBase.ExportAsync(ChartExportFormat, Nullable<Int32>, Nullable<Color>) Method
SECURITY-RELATED CONSIDERATIONS
The style-src: unsafe-inline CSP directive is not compatible with the ExportAsync method. Refer to the following help topic for additional information:
Encodes the chart to a string in a specified format with the given margin and background.
Namespace: DevExpress.Blazor
Assembly: DevExpress.Blazor.v26.1.dll
Declaration
public Task<string> ExportAsync(
    ChartExportFormat format,
    int? margin = null,
    Color? backgroundColor = null
)
Parameters
| Name | Type | Description |
|---|---|---|
| format | ChartExportFormat | The format of the exported file. |
Optional Parameters
| Name | Type | Default | Description |
|---|---|---|---|
| margin | Nullable<Int32> | null | The margin in pixels. |
| backgroundColor | Nullable<Color> | null | The background color in the exported file. |
Returns
| Type | Description |
|---|---|
| Task<String> | A structure that stores an awaitable result of an asynchronous operation. |
Remarks
Call ExportAsync method overloads to export chart data to a file in the specified format: PNG, PDF, JPEG, or GIF.
Warning
DxChart, DxPolarChart, and DxPieChart components can export data in different formats only if the browser supports these formats. Otherwise, charts export data to PNG regardless of which option you select in the menu.
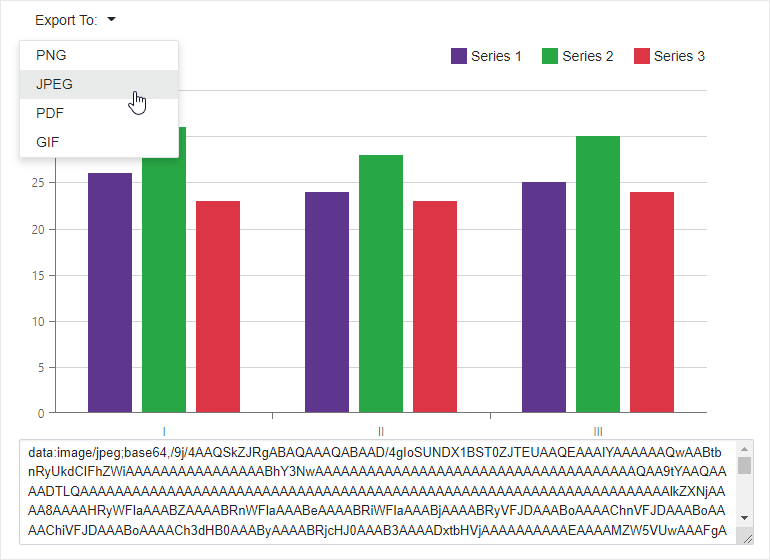
The following example encodes a chart in different formats to a Base64 object. A user can select the format from the Export To drop-down list in the menu at the top.
The DxMemo shows the encoded text:
@page "/"
@using System.Drawing
<DxMenu ItemClick="Export">
    <Items>
        <DxMenuItem Text="Export To:">
            <Items>
                <DxMenuItem Text="PNG" />
                <DxMenuItem Text="JPEG" />
                <DxMenuItem Text="PDF" />
                <DxMenuItem Text="GIF" />
            </Items>
        </DxMenuItem>
    </Items>
</DxMenu>
<DxChart @ref="@chart"
         Data="@dataPoints"
         Width=700 Height=400>
    <DxChartBarSeries ArgumentField="@((DataPoint i) => i.Arg)"
                      ValueField="@((DataPoint i) => i.Value1)"
                      Name="Series 1" />
    <DxChartBarSeries ArgumentField="@((DataPoint i) => i.Arg)"
                      ValueField="@((DataPoint i) => i.Value2)"
                      Name="Series 2" />
    <DxChartBarSeries ArgumentField="@((DataPoint i) => i.Arg)"
                      ValueField="@((DataPoint i) => i.Value3)"
                      Name="Series 3" />
    <DxChartLegend Orientation="Orientation.Horizontal"
                   HorizontalAlignment="HorizontalAlignment.Right"
                   Position="RelativePosition.Outside" />
</DxChart>
<DxMemo @bind-Text=@TextValue Rows=5 Columns=100 />

@code {

    DxChartBase chart;
    private DataPoint[] dataPoints;
    public string TextValue { get; set; }
    protected override void OnInitialized() {
        dataPoints = GetDataPoints();
    }
    async void Export(MenuItemClickEventArgs args) {
        ChartExportFormat format = ChartExportFormat.Png;
        Color backgroundColor = Color.White;
        int margin = 4;
        if (Enum.TryParse<ChartExportFormat>(args.ItemInfo.Text, true, out format)) {
            // Encode the chart to a string:
            TextValue = await chart?.ExportAsync(format, margin, backgroundColor);
        }
    }
    public class DataPoint {
        public string Arg { get; set; }
        public int Value1 { get; set; }
        public int Value2 => (int)(Value1 * 1.2);
        public double Value3 { get; set; }
    }
    public DataPoint[] GetDataPoints() {
        DataPoint[] dataPoints = new DataPoint[] {
            new DataPoint() { Arg = "I", Value1 = 26, Value3 = 23},
            new DataPoint() { Arg = "II", Value1 = 24, Value3 = 23},
            new DataPoint() { Arg = "III", Value1 = 25, Value3 = 24},
        };
        return dataPoints;
    }
}