DxChartArgumentAxis.AggregationGroupWidth Property
Specifies the width of aggregation intervals in pixels. Applies only to axes of continuous and logarithmic types.
Namespace: DevExpress.Blazor
Assembly: DevExpress.Blazor.v26.1.dll
Declaration
[Parameter]
public double? AggregationGroupWidth { get; set; }
Property Value
| Type | Description |
|---|---|
| Nullable<Double> | The group width in pixels. |
Remarks
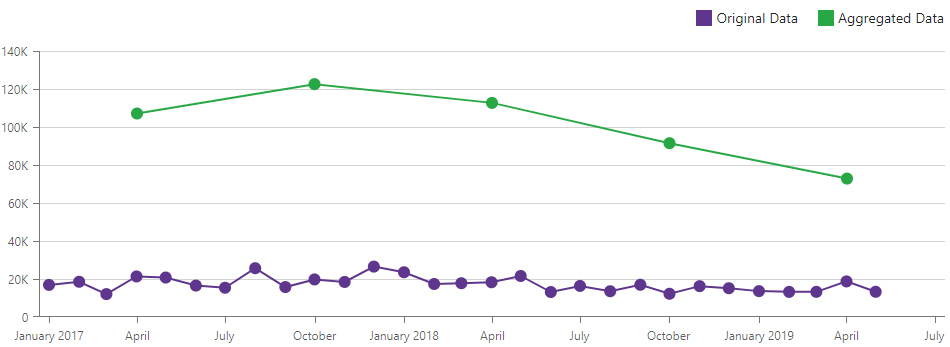
The Chart divides the argument axis into intervals to aggregate data. Series points that appear in the same interval are aggregated together. The AggregationGroupWidth property defines the width of each interval in pixels. To specify the interval in axis units, use the AggregationInterval property. The AggregationInterval property has a priority over the AggregationGroupWidth property.
The following example sets the interval width to 150 pixels:
<DxChart Data="@ChartsData">
    <DxChartLineSeries Name="Original Data"
                       T="SaleInfo"
                       TArgument="DateTime"
                       TValue="int"
                       ArgumentField="si => new DateTime(si.Date.Year, si.Date.Month, 1)"
                       ValueField="si => si.Amount"
                       Filter='si => si.Region == "North America"' />
    <DxChartLineSeries Name="Aggregated Data"
                       T="SaleInfo"
                       TArgument="DateTime"
                       TValue="int"
                       ArgumentField="si => new DateTime(si.Date.Year, si.Date.Month, 1)"
                       ValueField="si => si.Amount"
                       Filter='si => si.Region == "North America"'>
        <DxChartAggregationSettings Enabled="true" Method="ChartAggregationMethod.Sum" />
    </DxChartLineSeries>
    <DxChartArgumentAxis AggregationGroupWidth="100" />
    <DxChartLegend Position="RelativePosition.Outside"
                   HorizontalAlignment="HorizontalAlignment.Right" />
</DxChart>
See Also