DxChartArgumentAxis.ArgumentType Property
Specifies whether and how to cast arguments that come from the assigned data source.
Namespace: DevExpress.Blazor
Assembly: DevExpress.Blazor.v26.1.dll
Declaration
[DefaultValue(ChartAxisDataType.Auto)]
[Parameter]
public ChartAxisDataType ArgumentType { get; set; }
Property Value
| Type | Default | Description |
|---|---|---|
| ChartAxisDataType | Auto | A ChartAxisDataType enumeration value. |
Available values:
| Name | Description |
|---|---|
| Auto | Does not cast arguments/values and displays them on the axis of the applicable type (Continuous for integer and float data types and Discrete for other data types). |
| Numeric | Casts arguments/values to a numeric type and displays them on the Continuous axis. To parse strings successfully, the decimal separator should be ‘.’. |
| String | Casts arguments/values to the String type and displays them on the Discrete axis. |
| DateTime | Casts arguments/values to the DateTime type and displays them on the Continuous axis. To parse strings successfully, the value should match the ISO JavaScript Date pattern. |
Remarks
You can cast the chart’s values and arguments to the specified data type, for instance, when the assigned data source stores dates or numbers as strings. To do this, use the argument axis’ ArgumentType property and the value axis’ ValueType properties. The following property values are available:
Value | Description |
|---|---|
Auto (Default) | Does not cast arguments/values and displays them on the axis of the applicable type (Continuous for integer and float data types and Discrete for other data types). |
Casts arguments/values to the String type and displays them on the Discrete axis. | |
Casts arguments/values to a numeric type and displays them on the Continuous axis. To parse strings successfully, the decimal separator should be ‘.’. | |
Casts arguments/values to the DateTime type and displays them on the Continuous axis. To parse strings successfully, the value should match the ISO JavaScript Date pattern. |
To change the axis type, use the DxChartAxis.Type and DxChartArgumentAxis.Type properties.
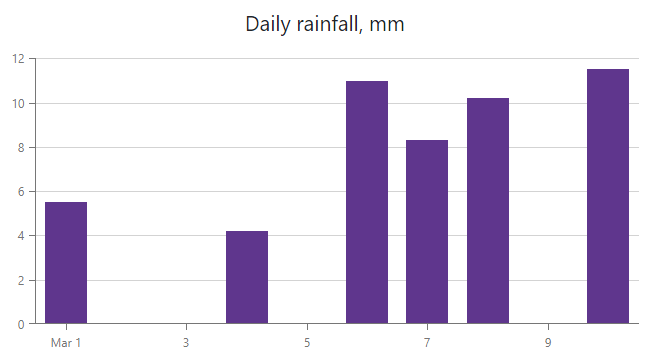
The following example casts the chart’s arguments to the DateTime type and values to a numeric type.
<DxChart Data="@GetData()">
    <DxChartTitle Text="@($"Daily rainfall, mm")" />
    <DxChartArgumentAxis ArgumentType="ChartAxisDataType.DateTime" />
    <DxChartValueAxis ValueType="ChartAxisDataType.Numeric" />
    <DxChartLegend Visible="false" />
    <DxChartBarSeries ArgumentField="@((DataPoint s) => s.Argument)" ValueField="@((DataPoint s) => s.Value)" />
</DxChart>