DxChartArgumentAxis.AggregatedPointPosition Property
Specifies where aggregated series points appear relative to major tick marks. Applies only to axes of continuous and logarithmic types.
Namespace: DevExpress.Blazor
Assembly: DevExpress.Blazor.v26.1.dll
Declaration
[DefaultValue(ChartAggregatedPointPosition.BetweenTicks)]
[Parameter]
public ChartAggregatedPointPosition AggregatedPointPosition { get; set; }
Property Value
| Type | Default | Description |
|---|---|---|
| ChartAggregatedPointPosition | BetweenTicks | An enumeration value. |
Available values:
| Name | Description |
|---|---|
| BetweenTicks | Displays aggregated points between major tick marks. |
| CrossTicks | Displays aggregated points aligned with major tick marks. |
Remarks
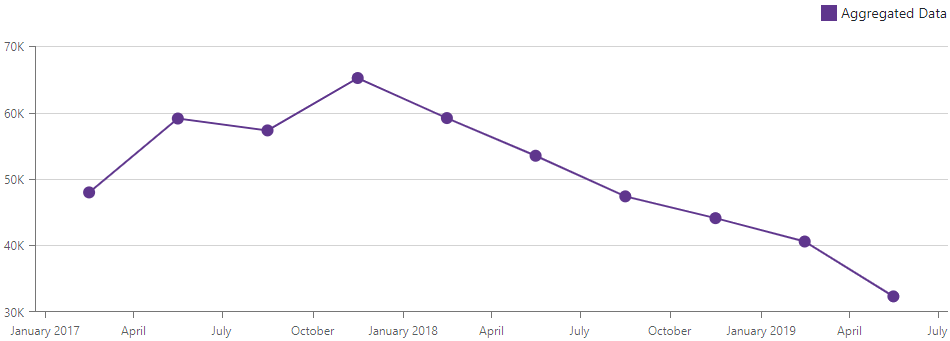
The Chart’s argument axes display aggregated points between two neighboring major ticks as shown in the image below. This behavior corresponds to the BetweenTicks mode:
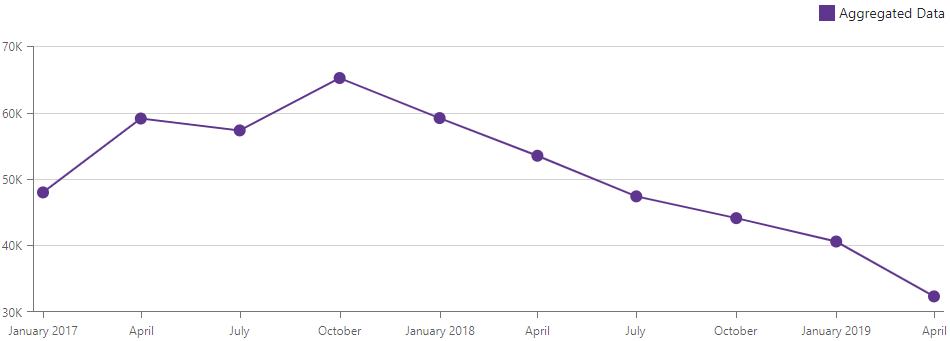
The following example aligns aggregated points to major tick marks:
<DxChart Data="@ChartsData">
    <DxChartLineSeries Name="Aggregated Data"
                       T="SaleInfo"
                       TArgument="DateTime"
                       TValue="int"
                       ArgumentField="si => new DateTime(si.Date.Year, si.Date.Month, 1)"
                       ValueField="si => si.Amount"
                       Filter='si => si.Region == "North America"'>
        <DxChartAggregationSettings Enabled="true" Method="ChartAggregationMethod.Sum" />
    </DxChartLineSeries>
    <DxChartArgumentAxis AggregationInterval="ChartAxisInterval.Quarter"
                         AggregatedPointPosition="ChartAggregatedPointPosition.CrossTicks"/>
    <DxChartLegend Position="RelativePosition.Outside"
                   HorizontalAlignment="HorizontalAlignment.Right" />
</DxChart>
See Also