DxChartValueAxis.MaxAutoBreakCount Property
Specifies the maximum number of autocreated scale breaks.
Namespace: DevExpress.Blazor
Assembly: DevExpress.Blazor.v25.2.dll
NuGet Package: DevExpress.Blazor
Declaration
[DefaultValue(4)]
[Parameter]
public int MaxAutoBreakCount { get; set; }
Property Value
| Type | Default | Description |
|---|---|---|
| Int32 | 4 | The maximum number of auto-created breaks. |
Remarks
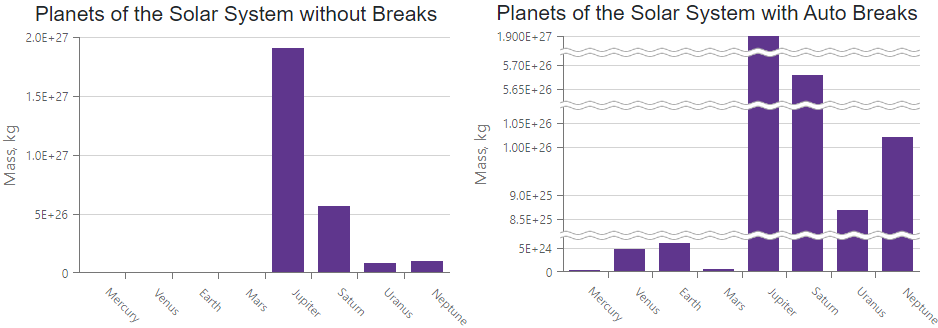
A scale break allows you to cut a part of the axis to improve the readability of a chart with high amplitude values or outliers. You can specify as many breaks as required manually. In addition to manual breaks, you can use the AutoBreaksEnabled property to calculate scale breaks automatically. The number of calculated breaks depends on the source data.
For example, AutoBreaksEnabled creates three scale breaks for the following data source:
@code {
    List<Planet> GetPlanets() {
        List<Planet> result = new List<Planet>();
        result.Add(new Planet("Mercury", 3.30E23));
        result.Add(new Planet("Venus", 4.87E24));
        result.Add(new Planet("Earth", 5.97E24));
        result.Add(new Planet("Mars", 6.42E23));
        result.Add(new Planet("Jupiter", 1.90E27));
        result.Add(new Planet("Saturn", 5.68E26));
        result.Add(new Planet("Uranus", 8.68E25));
        result.Add(new Planet("Neptune", 1.02E26));
        return result;
    }
    struct Planet {
        public Planet(string name, double mass) { Name = name; Mass = mass; }
        public string Name { get; set; }
        public double Mass { get; set; }
    }
}

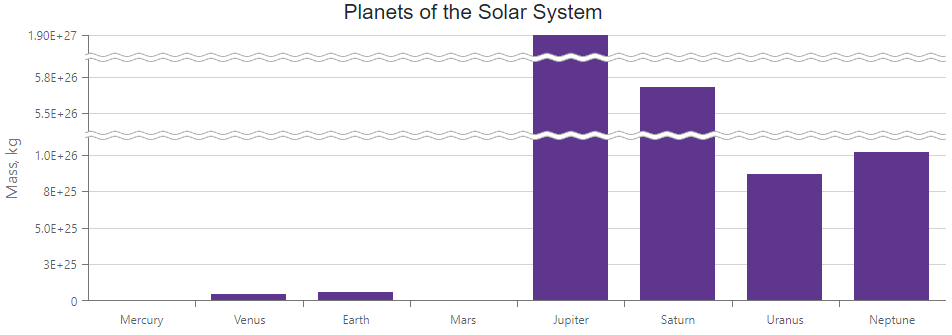
The MaxAutoBreakCount property allows you to limit the maximum number of autocreated scale breaks if the AutoBreaksEnabled property is set to true. Note that this number does not include scale breaks (DxChartScaleBreak components) added in markup.
The following example sets the MaxAutoBreakCount property to 2:
<DxChart Data="@GetPlanets()">
    <DxChartTitle Text="Planets of the Solar System"></DxChartTitle>
    <DxChartArgumentAxis Type="ChartAxisType.Discrete"></DxChartArgumentAxis>
    <DxChartValueAxis Type="ChartAxisType.Continuous"
                      AutoBreaksEnabled="true" MaxAutoBreakCount="2">
        <DxChartAxisTitle Text="Mass, kg"></DxChartAxisTitle>
    </DxChartValueAxis>
    <DxChartBarSeries ArgumentField="@((Planet s) => s.Name)" ValueField="@((Planet s) => s.Mass)">
        <DxChartLegend Visible="false"></DxChartLegend>
    </DxChartBarSeries>
</DxChart>
