DxChartValueAxis.AutoBreaksEnabled Property
Specifies whether to enable autocalculated scale breaks.
Namespace: DevExpress.Blazor
Assembly: DevExpress.Blazor.v25.2.dll
NuGet Package: DevExpress.Blazor
Declaration
[Parameter]
public bool AutoBreaksEnabled { get; set; }
Property Value
| Type | Description |
|---|---|
| Boolean |
|
Remarks
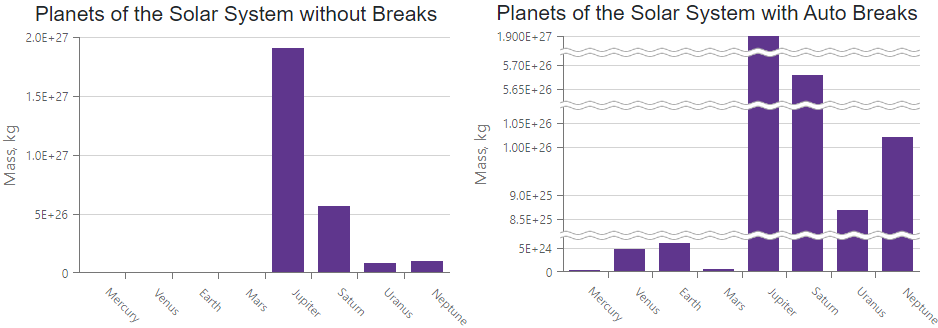
A scale break is an area across an axis that is shown in place of a section of the axis’ range. It appears across the original axis as a wavy line. Scale breaks allow you to break off parts of the axis to improve the readability of a chart with large differences between high and low values.
The following example displays scale breaks within the Chart component:
<DxChart Data="@GetPlanets()">
    <DxChartTitle Text="Planets of the Solar System"></DxChartTitle>
    <DxChartArgumentAxis Type="ChartAxisType.Discrete"></DxChartArgumentAxis>
    <DxChartValueAxis Type="ChartAxisType.Continuous" AutoBreaksEnabled="true">
        <DxChartAxisTitle Text="Mass, kg"></DxChartAxisTitle>
    </DxChartValueAxis>
    <DxChartBarSeries ArgumentField="@((Planet s) => s.Name)" ValueField="@((Planet s) => s.Mass)">
        <DxChartLegend Visible="false"></DxChartLegend>
    </DxChartBarSeries>
</DxChart>

@code {
    List<Planet> GetPlanets() {
        List<Planet> result = new List<Planet>();
        result.Add(new Planet("Mercury", 3.30E23));
        result.Add(new Planet("Venus", 4.87E24));
        result.Add(new Planet("Earth", 5.97E24));
        result.Add(new Planet("Mars", 6.42E23));
        result.Add(new Planet("Jupiter", 1.90E27));
        result.Add(new Planet("Saturn", 5.68E26));
        result.Add(new Planet("Uranus", 8.68E25));
        result.Add(new Planet("Neptune", 1.02E26));
        return result;
    }
    struct Planet {
        public Planet (string name, double mass) { Name = name; Mass = mass; }
        public string Name { get; set; }
        public double Mass { get; set; }
    }
}

The MaxAutoBreakCount property allows you to limit the maximum number of autocreated scale breaks if the AutoBreaksEnabled property value is true.