DxChartConstantLine.ExtendAxis Property
Specifies whether to extend the visual range of the axis to display the constant line.
Namespace: DevExpress.Blazor
Assembly: DevExpress.Blazor.v26.1.dll
Declaration
[DefaultValue(false)]
[Parameter]
public bool ExtendAxis { get; set; }
Property Value
| Type | Default | Description |
|---|---|---|
| Boolean | false |
|
Remarks
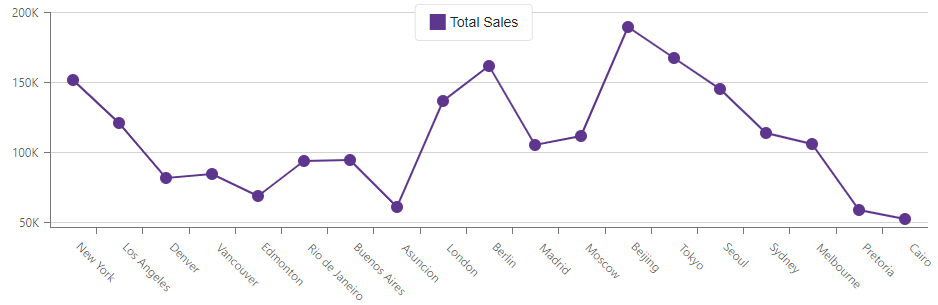
The chart area’s visual range is a range of values that you can see on an axis. The visual range depends on the data source values.
If the constant line’s Value is outside the visual range, the chart does not show the line in the chart area. In the following code snippet, the visual range of the value axis is between 50000 and 200000. The constant line value is 230000, which is outside visible range.
<DxChart Data="@SalesData">
    <DxChartLineSeries Name="Total Sales"
                       ArgumentField="@((SaleInfo s) => s.City)"
                       ValueField="@((SaleInfo s) => s.Amount)"
                       SummaryMethod="Enumerable.Sum">
    </DxChartLineSeries>
    <DxChartValueAxis>
        <DxChartConstantLine Value="230000">
            <DxChartConstantLineLabel Text="Planned Amount" />
        </DxChartConstantLine>
        @* ... *@
    </DxChartValueAxis>
</DxChart>
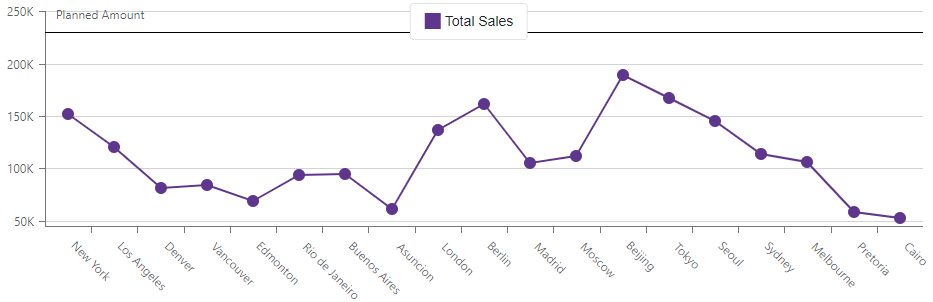
Set the ExtendAxis property value to true to extend the axis so that the constant line becomes visible.
<DxChart Data="@SalesData">
@* ... *@
    <DxChartValueAxis>
    @* ... *@
        <DxChartConstantLine Value="230000" ExtendAxis="true">
            <DxChartConstantLineLabel Text="Planned Amount" />
        </DxChartConstantLine>
    </DxChartValueAxis>
</DxChart>
You can use the DxChartAxisRange property to force the chart to cut the axis at the specified values. In this case, the ExtendAxis property will have no effect.