DxChartAxis<T>.SideMarginsEnabled Property
Specifies whether the component should add margins between the outermost series points and the chart boundaries.
Namespace: DevExpress.Blazor
Assembly: DevExpress.Blazor.v25.2.dll
NuGet Package: DevExpress.Blazor
Declaration
[DefaultValue(true)]
[Parameter]
public bool SideMarginsEnabled { get; set; }
Property Value
| Type | Default | Description |
|---|---|---|
| Boolean | true |
|
Remarks
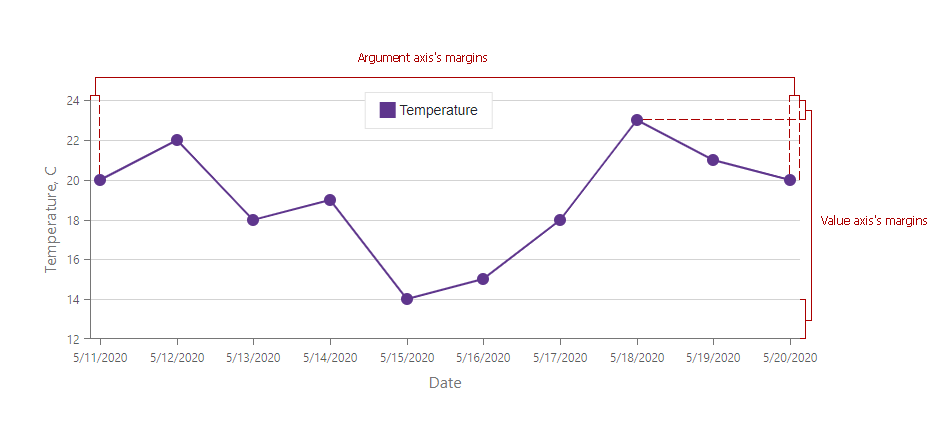
The Chart adds margins between the outermost series points and the component’s boundaries. Minimum and maximum series points appear inside the chart area.

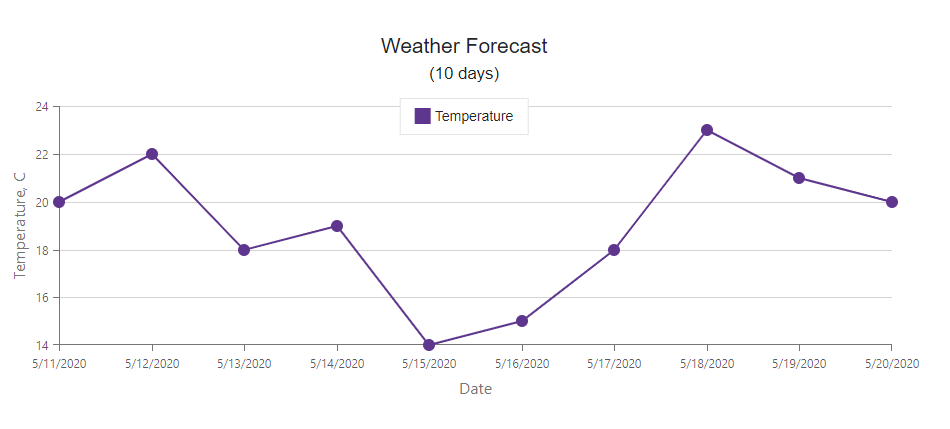
To change the default behavior and remove the margins, set the SideMarginsEnabled property to false. Maximum and minimum series points fall onto the axis lines.
<DxChart Data="@forecasts">
    <DxChartArgumentAxis SideMarginsEnabled="false"></DxChartArgumentAxis>
    <DxChartValueAxis SideMarginsEnabled="false"></DxChartValueAxis>
    @* ... *@
</DxChart>

You can also use the EndOnTick property to extend Chart’s axes so that they start and end on ticks.