DxChart<T>.SetValueAxisVisualRange(List<Object>, String) Method
Applies a specific visual range to a value axis.
Namespace: DevExpress.Blazor
Assembly: DevExpress.Blazor.v25.2.dll
NuGet Package: DevExpress.Blazor
Declaration
public void SetValueAxisVisualRange(
    List<object> range,
    string axisName = null
)
Parameters
| Name | Type | Description |
|---|---|---|
| range | List<Object> | The value range. |
Optional Parameters
| Name | Type | Default | Description |
|---|---|---|---|
| axisName | String | null | The value axis name |
Remarks
The Chart component may include multiple value axes. To apply a visual range to a specific axis, set its name in markup and pass it to the SetValueAxisVisualRange method as a parameter.
If you do not pass the axis name, the Chart applies the specified visual range as follows:
- Single-pane charts
- To the first value axis in chart markup.
- Multi-pane charts
- To the value axis that belongs to the default pane.
Note
We do not recommend that you call the SetValueAxisVisualRange method in single-pane charts with multiple axes. Once you call the method, the Chart tries to adjust visual ranges for all value axes and may render series incorrectly.
You can also apply a specific visual range to the argument axis using the SetArgumentAxisVisualRange method. To reset visual ranges for all axes, call the ResetVisualRange() method.
To respond to visual range changes, handle the Chart’s VisualRangeChanged event.
Example
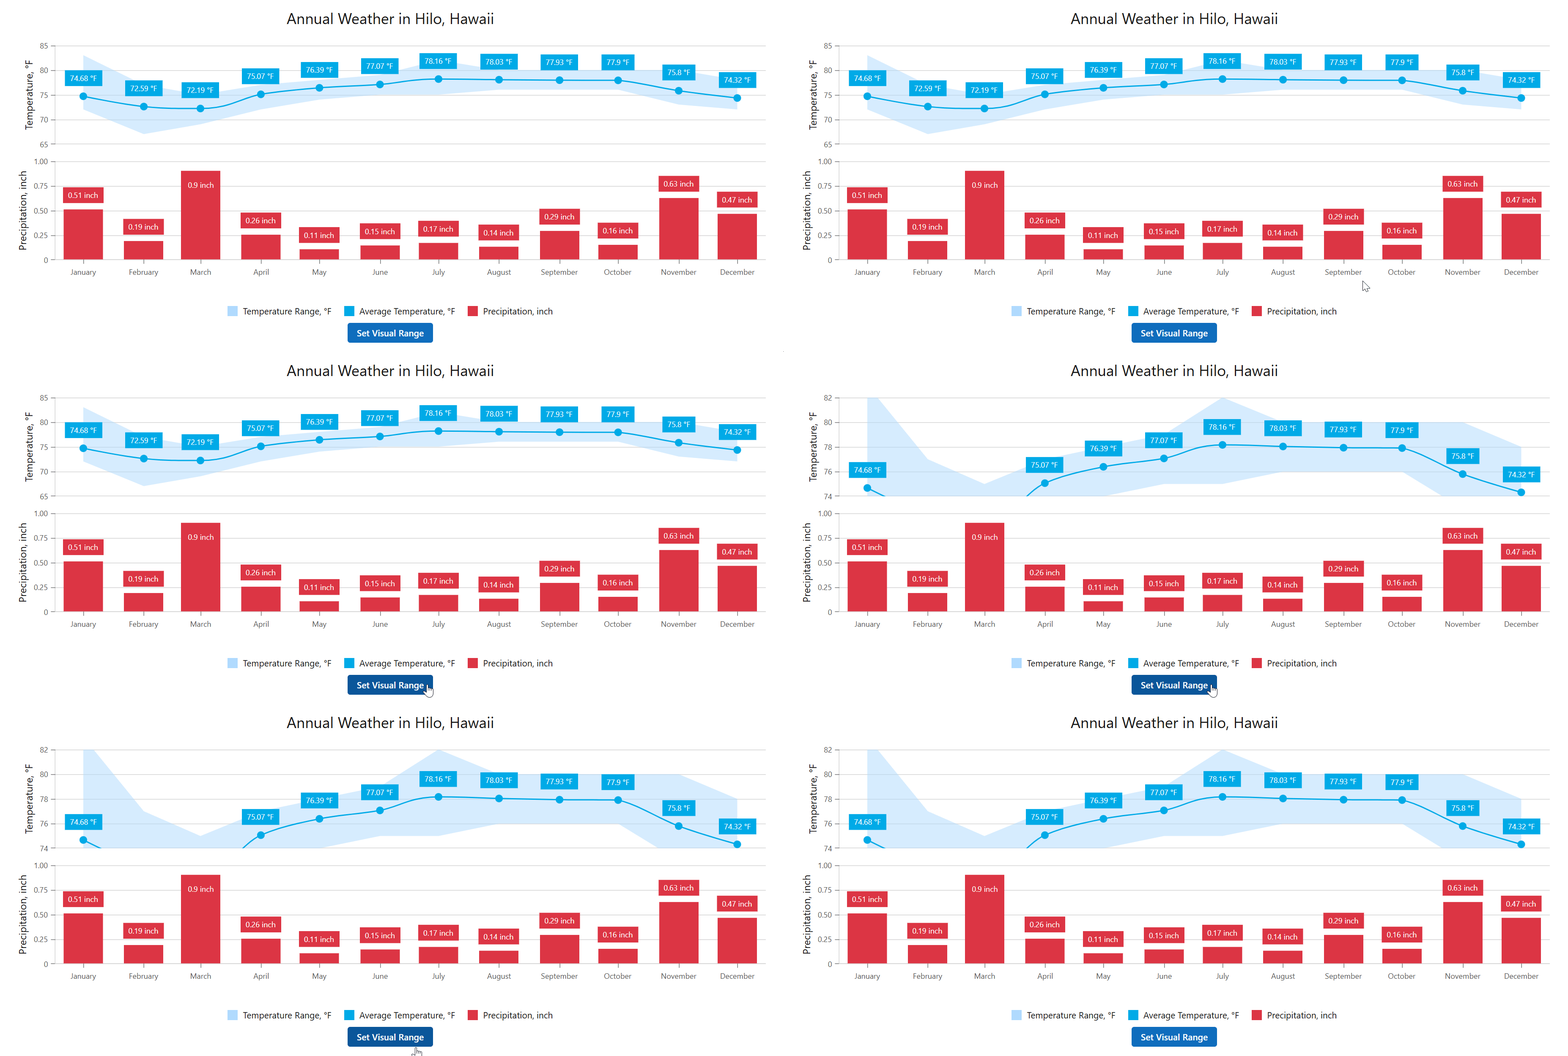
The following code snippet displays a custom Set Visual Range button that applies a specific visual range to the Temperature value axis:

@inject IWeatherSummaryDataProvider WeatherSummaryDataProvider

<DxChart @ref="@chart"
         Data="weatherForecasts"
         Width="100%"
         Height="500px">
    <DxChartTitle Text="Annual Weather in Hilo, Hawaii" />
    @* ...*@
    <DxChartPane Name="TopPane" />
    <DxChartPane Name="BottomPane" />
    <DxChartRangeAreaSeries Pane="TopPane"
                            Name="Temperature Range, °F"
                            ArgumentField="@(i => new DateTime(2000, i.Date.Month, 1))"
                            ValueField="@((DetailedWeatherSummary s) => s.AverageTemperatureF)"
                            Color="@(Color.FromArgb(176, 218, 255))" />
    <DxChartSplineSeries Pane="TopPane"
                         Name="Average Temperature, °F"
                         SummaryMethod="Enumerable.Average"
                         ArgumentField="@(i => new DateTime(2000, i.Date.Month, 1))"
                         ValueField="@((DetailedWeatherSummary s) => s.AverageTemperatureF)"
                         Color="@(Color.FromArgb(0, 169, 230))" >
        <DxChartSeriesLabel Visible="true"
                            ValueFormat="@(ChartElementFormat.FromLdmlString("0#.## °F"))" />
    </DxChartSplineSeries>
    <DxChartBarSeries Pane="BottomPane"
                      Name="Precipitation, inch"
                      ArgumentField="@(i => new DateTime(2000, i.Date.Month, 1))"
                      SummaryMethod="Enumerable.Average"
                      ValueField="@((DetailedWeatherSummary s) => s.PrecipitationInch)"
                      Color="@(Color.FromArgb(220, 53, 69))">
        <DxChartSeriesLabel Visible="true"
                            ValueFormat="@(ChartElementFormat.FromLdmlString("0#.## inch"))" />
    </DxChartBarSeries>
    <DxChartValueAxis Pane="TopPane"
                      Name="Temperature">
        <DxChartAxisTitle Text="Temperature, °F" />
    </DxChartValueAxis>
    <DxChartValueAxis Pane="BottomPane"
                      SideMarginsEnabled="true">
        <DxChartAxisTitle Text="Precipitation, inch" />
    </DxChartValueAxis>
    <DxChartArgumentAxis>
        <DxChartAxisLabel Format="ChartElementFormat.Month" />
    </DxChartArgumentAxis>
</DxChart>

<DxButton Text="Set Visual Range" Click="@SetVisualRange" />

@code {
    IEnumerable<DetailedWeatherSummary> weatherForecasts;
    DxChart<DetailedWeatherSummary> chart;

    void SetVisualRange() {
        chart.SetValueAxisVisualRange([75, 80], "Temperature");
    }

    protected override async Task OnInitializedAsync() {
        var weatherForecasts = await WeatherSummaryDataProvider.GetDataAsync();
        this.weatherForecasts = weatherForecasts.Where((DetailedWeatherSummary i) => i.City == "HILO");
    }
}