DxChartSeries.BreakOnEmptyPoints Property
Specifies whether the series should break on points with null values.
Namespace: DevExpress.Blazor
Assembly: DevExpress.Blazor.v26.1.dll
NuGet Package: DevExpress.Blazor
Declaration
[DefaultValue(false)]
[Parameter]
public bool BreakOnEmptyPoints { get; set; }
Property Value
| Type | Default | Description |
|---|---|---|
| Boolean | false |
|
Remarks
The default series ignores empty (null) values. In the image below, the value for May 15 is null:

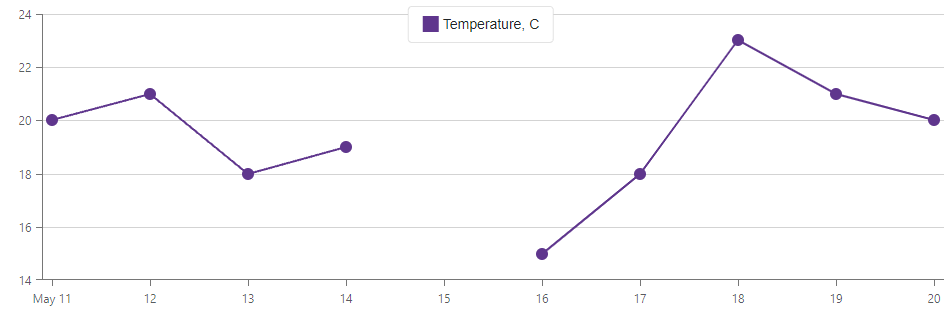
Set the BreakOnEmptyPoints property to true to change this behavior and remove the part of the series that corresponds to a point with a null value.
The following example uses the same dataset as the example above. The series below has a break on an empty point:
<DxChart Data="@forecasts">
    <DxChartLineSeries ArgumentField="@((WeatherForecast i) => i.Date)"
                       ValueField="@((WeatherForecast i) => i.TemperatureC)"
                       Name="Temperature, C"
                       BreakOnEmptyPoints="true">
    </DxChartLineSeries>
</DxChart>

@code {
    public class WeatherForecast {
        public DateTime Date { get; set; }
        public int? TemperatureC { get; set; }
    }

    WeatherForecast[] forecasts;
    protected override async Task OnInitializedAsync() {
        forecasts = GetForecast();
    }
    public WeatherForecast[] GetForecast() {
        WeatherForecast[] forecasts = new WeatherForecast[] {
            new WeatherForecast() { Date = new DateTime(2020, 05, 11), TemperatureC = 20 },
            new WeatherForecast() { Date = new DateTime(2020, 05, 12), TemperatureC = 21},
            new WeatherForecast() { Date = new DateTime(2020, 05, 13), TemperatureC = 18 },
            new WeatherForecast() { Date = new DateTime(2020, 05, 14), TemperatureC = 19 },
            new WeatherForecast() { Date = new DateTime(2020, 05, 15), TemperatureC = null },
            new WeatherForecast() { Date = new DateTime(2020, 05, 16), TemperatureC = 15 },
            new WeatherForecast() { Date = new DateTime(2020, 05, 17), TemperatureC = 18 },
            new WeatherForecast() { Date = new DateTime(2020, 05, 18), TemperatureC = 23 },
            new WeatherForecast() { Date = new DateTime(2020, 05, 19), TemperatureC = 21 },
            new WeatherForecast() { Date = new DateTime(2020, 05, 20), TemperatureC = 20 },
        };
        return forecasts;
    }
}
Note
If you use the Enumerable.Sum summary method to group points with null values, the Chart component may aggregate such values to 0. To create breaks in that case, implement a custom aggregation function. For example:
public static double? CustomSum(IEnumerable<double?> items) {
    if (items == null || items.Any(i => i == null)) {
        return null;
    }
    return items.Sum();
}