DxChartBase.Palette Property
Specifies the color scheme to colorize chart series.
Namespace: DevExpress.Blazor
Assembly: DevExpress.Blazor.v25.2.dll
NuGet Package: DevExpress.Blazor
Declaration
[Parameter]
public string[] Palette { get; set; }
Property Value
| Type | Description |
|---|---|
| String[] | An array of colors. |
Remarks
The Chart component allows you to create a custom palette to colorize chart series. To apply a palette, assign it to the Palette property.
The Palette property accepts the following formats:
- Longhand and shorthand hexadecimal color values:
#ffff00,#ff0. - RGB and RGBA color codes:
rgb(255, 0, 0),rgba(0, 230, 0, 0.3). - HTML color name (case-insensitive):
red,DarkGreen.
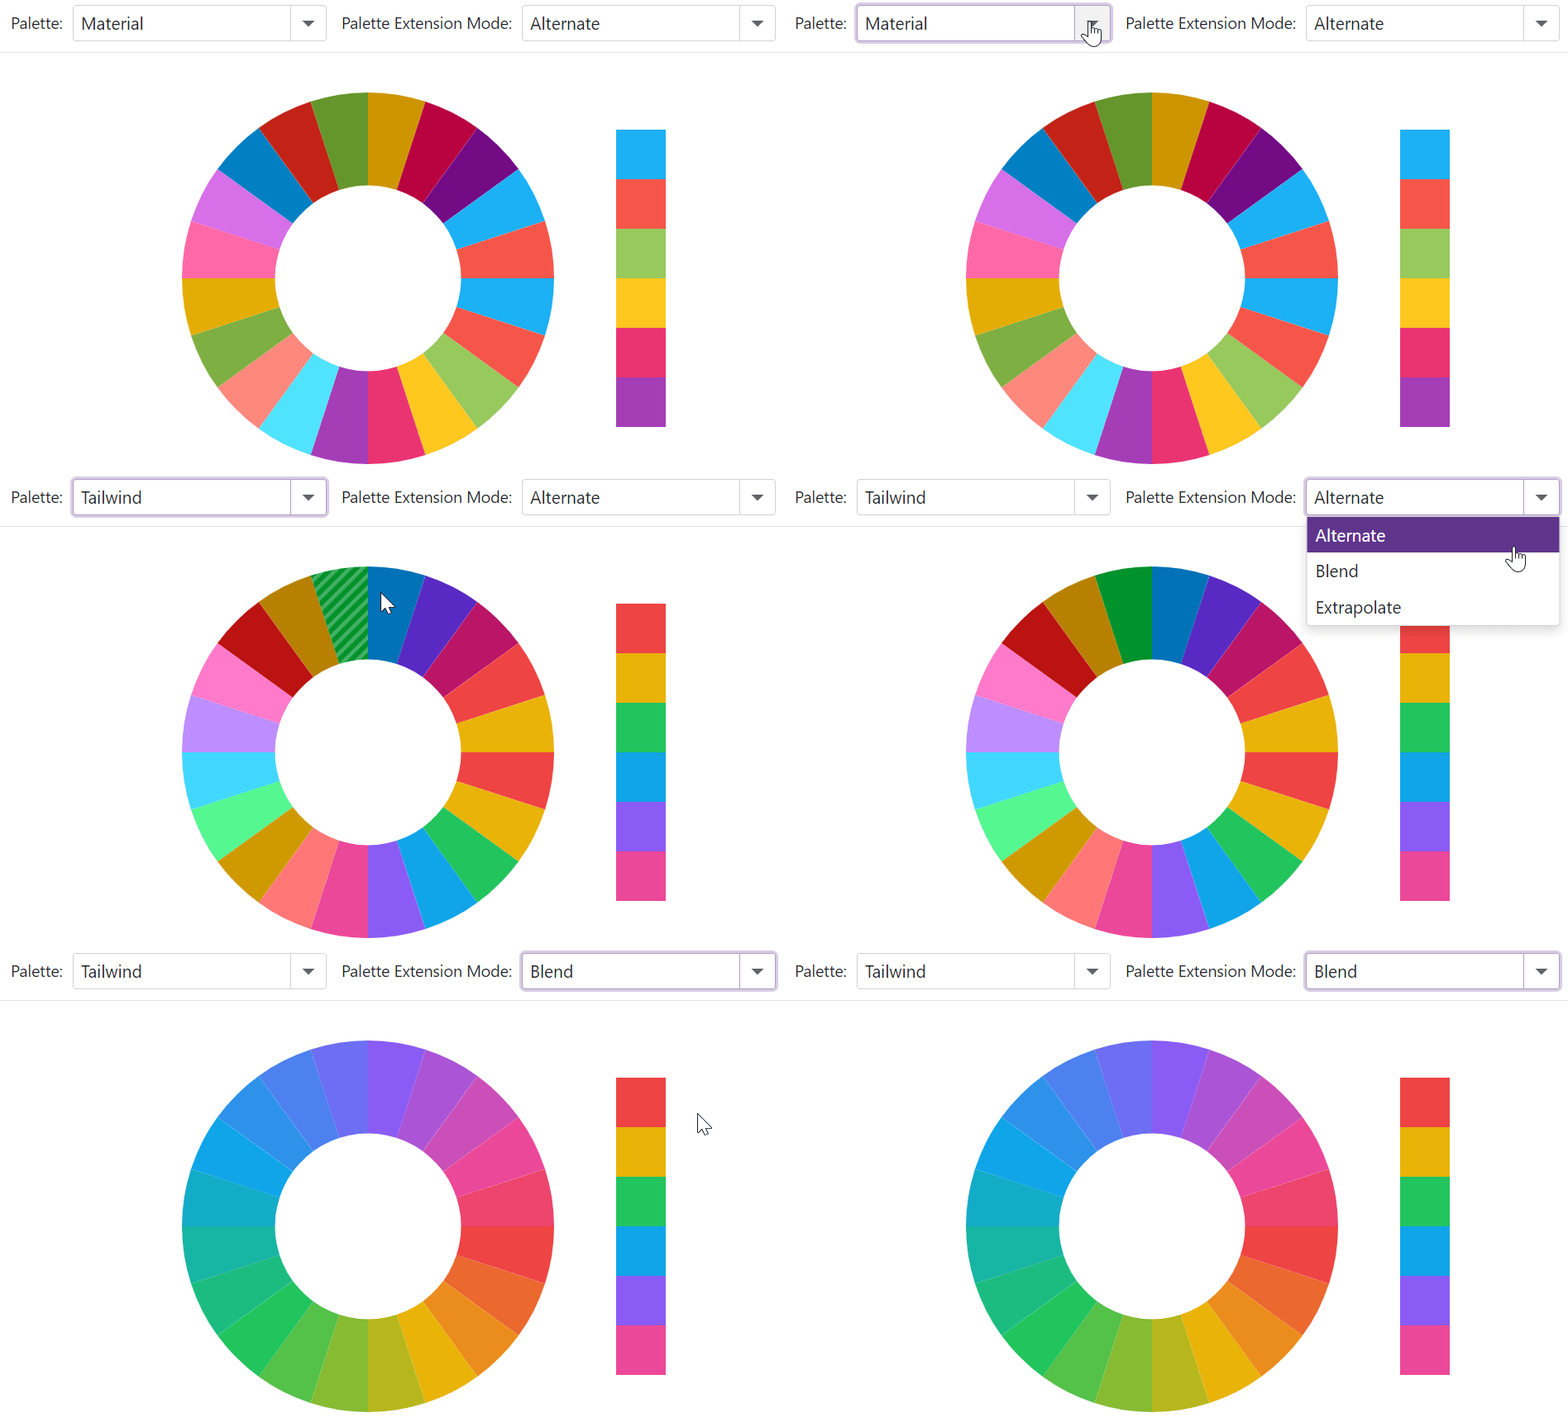
When the number of series (for DxChart) or series points (for DxPieChart) exceeds the number of palette colors, you can use the PaletteExtensionMode property to specify how to extend the palette.
The following example uses drop-down menus to change the color palette and its extension mode:
<div class="flex-container">
    <DxPieChart Data="@GetData()"
                Width="400"
                InnerDiameter="0.5"
                Palette="@CurrentColors"
                PaletteExtensionMode="@CurrentPaletteMode">
        <DxChartLegend Visible="false" />
        <DxPieChartSeries ArgumentField="@((DataPoint s) => s.Argument)"
                          ValueField="@((DataPoint s) => s.Value)" />
    </DxPieChart>
    <div class="palette-container">
        @foreach (var color in CurrentColors) {
            <div class="palette-item" style="background-color: @color"></div>
        }
    </div>
</div>

@code {
    public enum Palettes {
        Material,
        Bootstrap,
        Tailwind
    }
    Dictionary<Palettes, string[]> Colors = new Dictionary<Palettes, string[]>() {
        { Palettes.Material, new string[] { "#1db2f5", "#f5564a", "#97c95c", "#ffc720", "#eb3573", "#a63db8" } },
        { Palettes.Bootstrap, new string[] { "#0d6efd", "#6c757d", "#28a745", "#dc3545", "#ffc107", "#17a2b8" } },
        { Palettes.Tailwind, new string[] { "#ef4444", "#eab308", "#22c55e", "#0ea5e9", "#8b5cf6", "#ec4899" } }
    };
    string[] CurrentColors;
    Palettes currentPalette = Palettes.Material;
    Palettes CurrentPalette {
        get => currentPalette;
        set {
            CurrentColors = Colors[value];
            currentPalette = value;
        }
    }
    ChartPaletteExtensionMode CurrentPaletteMode = ChartPaletteExtensionMode.Alternate;
    List<DataPoint> GetData() {
        List<DataPoint> result = new List<DataPoint>();
        for(var i = 0; i < 20; i++) {
            result.Add(new DataPoint($"Item{i}", 1));
        }
        return result;
    }
    public class DataPoint {
        public string Argument { get; set; }
        public int Value { get; set; }
        public DataPoint(string argument, int value) {
            Argument = argument;
            Value = value;
        }
    }
    protected override void OnInitialized() {
        CurrentColors = Colors[currentPalette];
    }
}

See Also