DxChartSeriesValueErrorBar.Type Property
Specifies how the Chart component calculates error bar values.
Namespace: DevExpress.Blazor
Assembly: DevExpress.Blazor.v24.2.dll
NuGet Package: DevExpress.Blazor
#Declaration
[Parameter]
public ChartValueErrorBarType Type { get; set; }#Property Value
| Type | Description |
|---|---|
| Chart |
An enumeration value. |
Available values:
| Name | Description |
|---|---|
| None | Obtains error values from data source fields specified by High |
| Percent | Error bars display percentage of argument values. Percentage factor is specified by the Value property. |
|
Std |
Indicates the standard error. You can specify a coefficient to adjust the function result (use the Value property). |
|
Std |
Indicates the standard deviation. You can specify a coefficient to adjust the function result (use the Value property). |
| Variance | Indicates variance. You can specify a coefficient to adjust the function result (use the Value property). |
| Fixed | Error bars display constant values specified by the Value property. |
#Remarks
The DxChart component allows you to calculate error bar values based on a calculation algorithm. To enable this functionality, specify Type and Value properties.
Based on the Type property value, the Value property applies as follows:
- Fixed
- Specifies constant error values.
- Percent
- Specifies percentages of series point values.
- StdError
- Multiplies the calculated standard error.
- StdDeviation
- Multiplies the calculated standard deviation.
- Variance
- Multiplies the calculated variance.
- None
- Does not apply. The chart component obtains error bar values from data source fields.
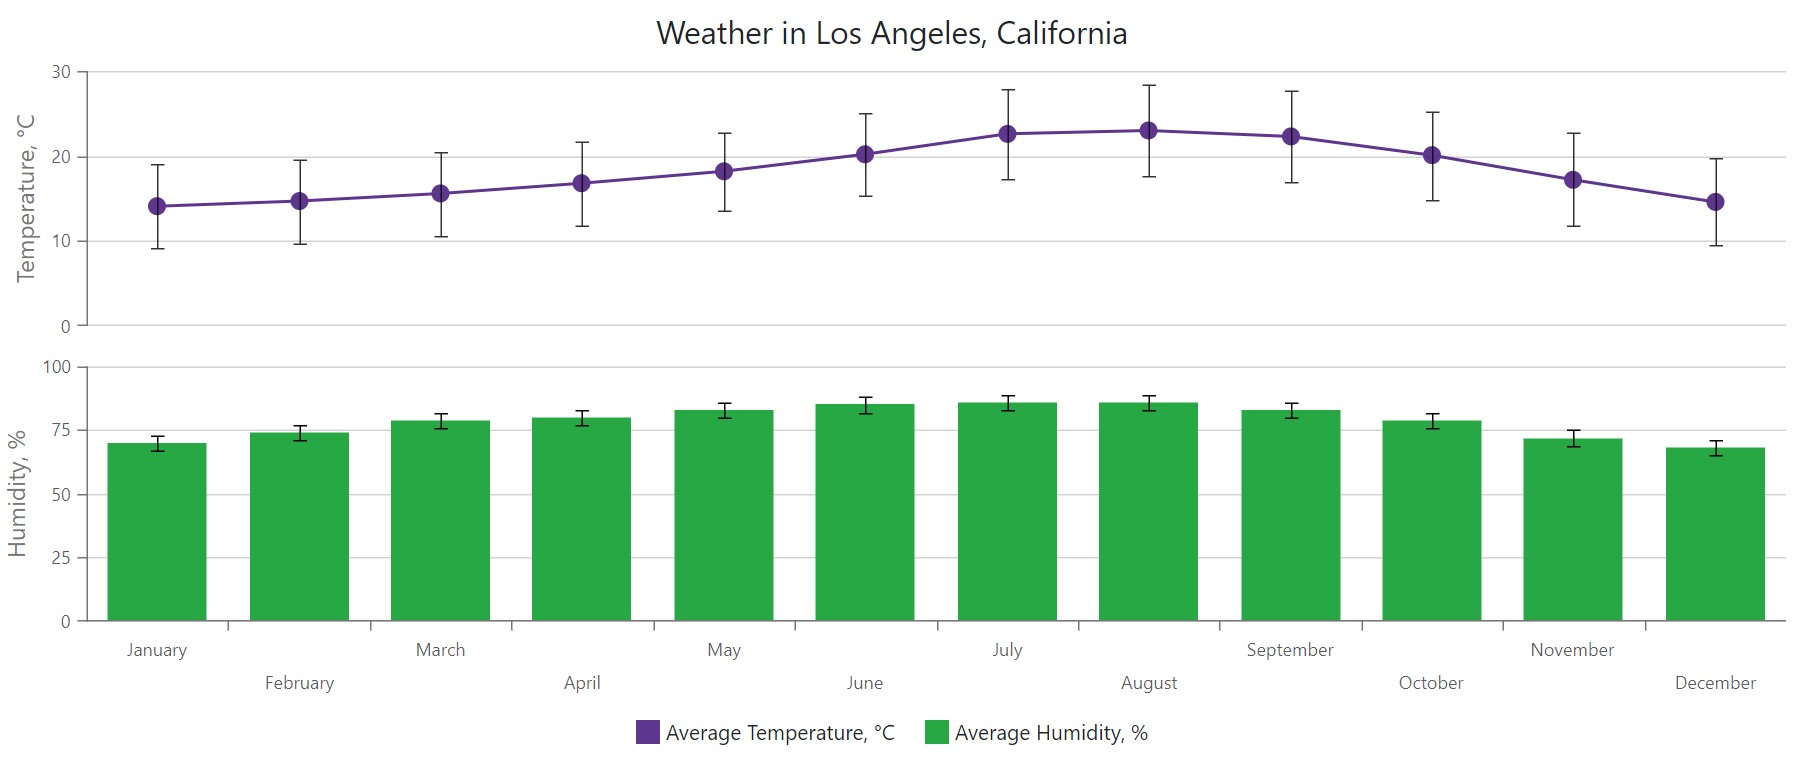
@inject IChartAverageTemperatureDataProvider ChartAverageTemperatureDataProvider
<DxChart Data="@DataSource">
    @* ... *@
    <DxChartLineSeries Pane="TopPane"
                       Name="@LineSeriesName"
                       ArgumentField="@((AverageTemperatureData i) => i.Month)"
                       ValueField="@((AverageTemperatureData i) => i.AverageTemperature)">
        <DxChartSeriesValueErrorBar LowValueField="@nameof(AverageTemperatureData.AverageLowTemperature)"
                                    HighValueField="@nameof(AverageTemperatureData.AverageHighTemperature)"
                                    LineWidth="1"
                                    Opacity="0.8"/>
    </DxChartLineSeries>
    <DxChartBarSeries Pane="BottomPane"
                      Name="@BarSeriesName"
                      ArgumentField="@((AverageTemperatureData i) => i.Month)"
                      ValueField="@((AverageTemperatureData i) => i.AverageHumidity)">
        <DxChartSeriesValueErrorBar Type="ChartValueErrorBarType.Fixed"
                                    Value="@ErrorBarValue"
                                    LineWidth="1" />
    </DxChartBarSeries>
    @* ... *@
</DxChart>

@code {
    IEnumerable<AverageTemperatureData> DataSource = Enumerable.Empty<AverageTemperatureData>();
    double ErrorBarValue = 6;
    protected override void OnInitialized() {
        DataSource = ChartAverageTemperatureDataProvider.GenerateData();
    }
    // ...
}