DxChartZoomAndPanDragBoxStyle.Opacity Property
Specifies the transparency of the drag box that appears when a user selects a chart area for zooming.
Namespace: DevExpress.Blazor
Assembly: DevExpress.Blazor.v25.2.dll
NuGet Package: DevExpress.Blazor
Declaration
[Parameter]
public double Opacity { get; set; }
Property Value
| Type | Description |
|---|---|
| Double | A value between |
Remarks
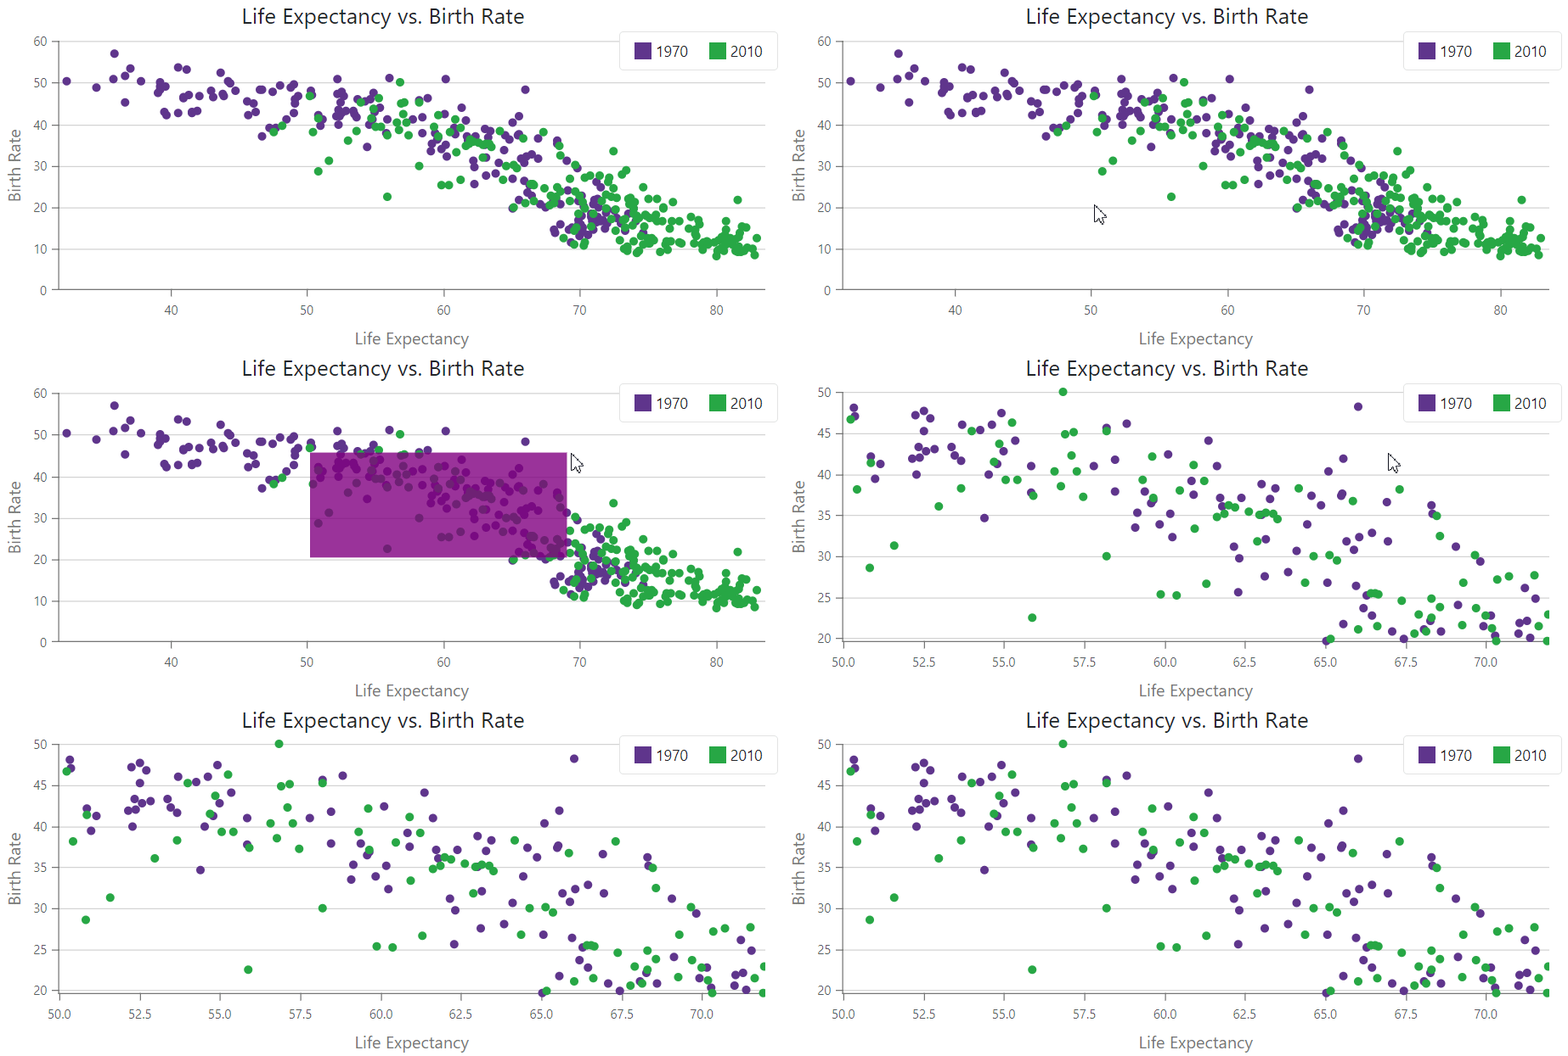
In DxChart, users can drag the mouse to select a chart area for zooming. To enable this functionality, set the AllowDragToZoom property to true.
The DxChartZoomAndPanDragBoxStyle component allows you to configure style settings for the drag box that appears when a user selects a chart area.
The Opacity property accepts values from 0 (transparent) to 1 (opaque).
The following code snippet colors the drag box purple and sets the opacity value to 0.8:
<DxChart Data="@DataSource"
         Width="100%">
    <DxChartTitle Text="Life Expectancy vs. Birth Rate" />
    <DxChartLegend Position="RelativePosition.Inside"
                    VerticalAlignment="VerticalEdge.Top"
                    HorizontalAlignment="HorizontalAlignment.Right" />
    <DxChartScatterSeries ArgumentField="@((BirthLife i) => i.LifeExp)"
                            ValueField="@((BirthLife i) => i.BirthRate)"
                            Filter="@((BirthLife i) => i.Year == 1970)"
                            Name="1970">
        <DxChartSeriesPoint Size="8" />
    </DxChartScatterSeries>
    <DxChartScatterSeries ArgumentField="@((BirthLife i) => i.LifeExp)"
                          ValueField="@((BirthLife i) => i.BirthRate)"
                          Filter="@((BirthLife i) => i.Year == 2010)"
                          Name="2010">
        <DxChartSeriesPoint Size="8" />
    </DxChartScatterSeries>
    <DxChartArgumentAxis>
        <DxChartAxisTitle Text="Life Expectancy" />
    </DxChartArgumentAxis>
    <DxChartValueAxis>
        <DxChartAxisTitle Text="Birth Rate" />
    </DxChartValueAxis>
    <DxChartTooltip Enabled="true">
        <div class="m-3">
            <div>@(((BirthLife)context.Point.DataItems.First()).Country)
                 @(((BirthLife)context.Point.DataItems.First()).Year)</div>
        </div>
    </DxChartTooltip>
    <DxChartZoomAndPanSettings ArgumentAxisZoomAndPanMode="ChartAxisZoomAndPanMode.Both"
                               ValueAxisZoomAndPanMode="ChartAxisZoomAndPanMode.Both"
                               AllowDragToZoom="true"
                               AllowMouseWheel="true"
                               PanKey="ChartEventPanKey.Shift">
        <DxChartZoomAndPanDragBoxStyle Color="purple" Opacity="0.8" />
    </DxChartZoomAndPanSettings>
</DxChart>

@code {
    IEnumerable<BirthLife> DataSource = Enumerable.Empty<BirthLife>();
    protected override void OnInitialized() {
        DataSource = ChartBirthLifeDataProvider.GenerateData();
    }
}
