DxPolarChart<T>.Data Property
Specifies an object that supplies Polar Chart data.
Namespace: DevExpress.Blazor
Assembly: DevExpress.Blazor.v24.2.dll
NuGet Package: DevExpress.Blazor
#Declaration
[Parameter]
public IEnumerable<T> Data { get; set; }#Property Value
| Type | Description |
|---|---|
| IEnumerable<T> | A data source. |
#Remarks
Use the Data property to bind the Polar Chart to data. Follow the steps below to display data within the component:
- Bind the
Dataparameter to a C# field or property. - Populate this field or property with data in the OnInitialized lifecycle method.
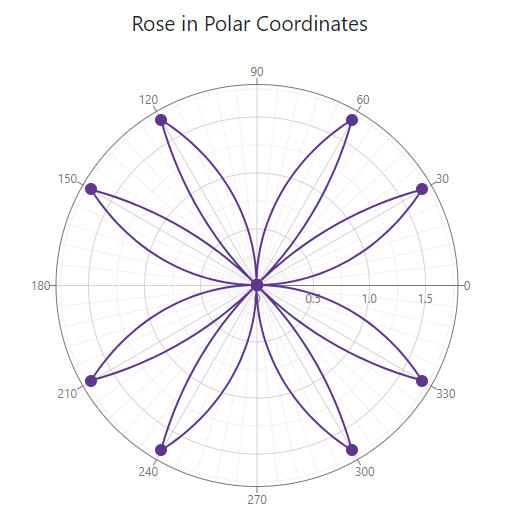
<DxPolarChart Data=@DataSource Width="100%" Height="500">
    <DxChartTitle>
        <div class="continuous-chart-title">
            Rose in Polar Coordinates
        </div>
    </DxChartTitle>
    <DxChartLegend Visible="false"/>
    <DxPolarChartArgumentAxis Inverted="true" StartAngle="90" TickInterval="30"/>
    <DxPolarChartLineSeries
        ArgumentField="@((DataPoint i) => i.X)"
        ValueField="@((DataPoint i) => i.Y)"/>
</DxPolarChart>

@code {
    IEnumerable<DataPoint> DataSource = Enumerable.Empty<DataPoint>();

    protected override void OnInitialized () {
        DataSource = ChartContinuousDataProvider.GenerateData();
    }
}
Note
When you bind a chart to DateUtc, the component converts dates (for example, when it displays axis labels). This occurs because DxLocal or Unspecified.
You can also adjust the time difference to display dates correctly. The following code snippet demonstrates a possible solution:
public WeatherForecast[] GetForecast() {
    var localZone = TimeZoneInfo.Local;
    var localOffset = localZone.GetUtcOffset(DateTime.UtcNow);
    var cur = DateTime.UtcNow.Add(localOffset);

    var utcDates = new List<DateTime> { cur };
    var dates = new List<DateTime>();
    foreach (var utcDate in utcDates)
        dates.Add(new DateTime(utcDate.Ticks));
    // ...
}